
 대표어
대표어
 https://www.accc.gov.au/about-us/publications/serial-publications/container-stevedoring-monitoring-reports/container-stevedoring-monitoring-report-2024-25



권호기사보기
| 기사명 | 저자명 | 페이지 | 원문 | 기사목차 |
|---|
결과 내 검색
동의어 포함
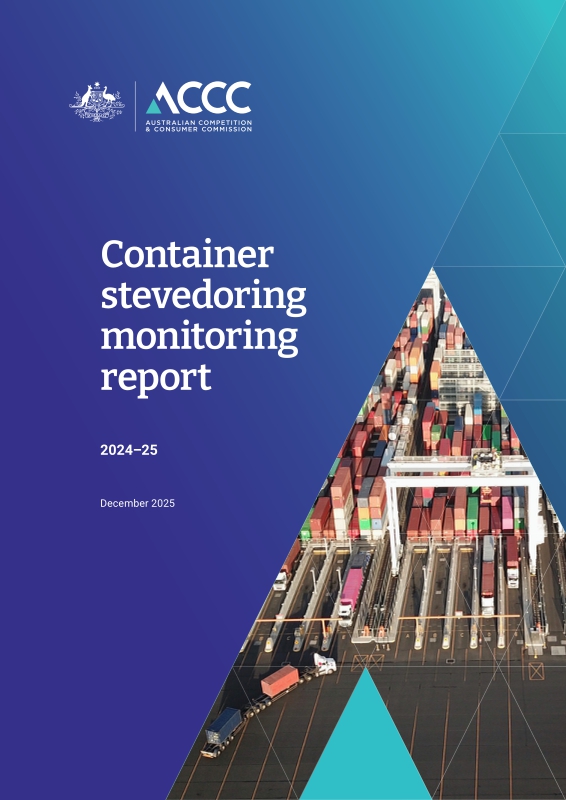
Title page 1
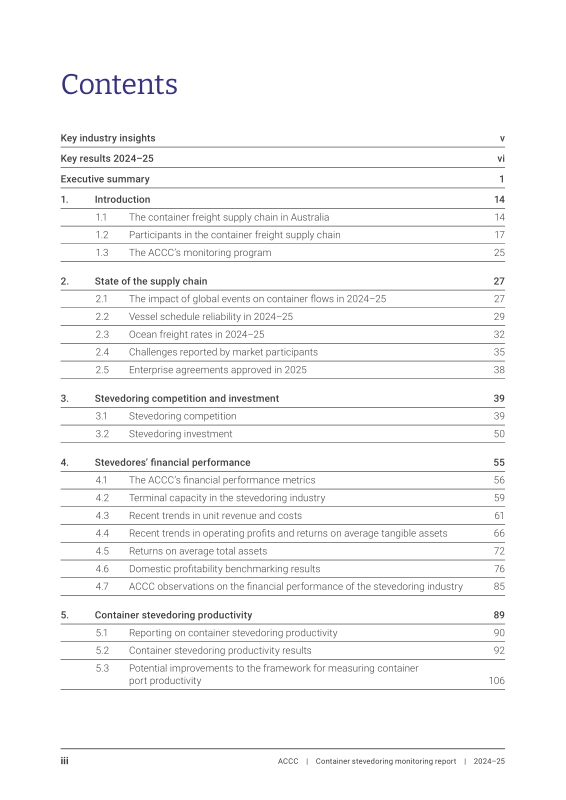
Contents 3
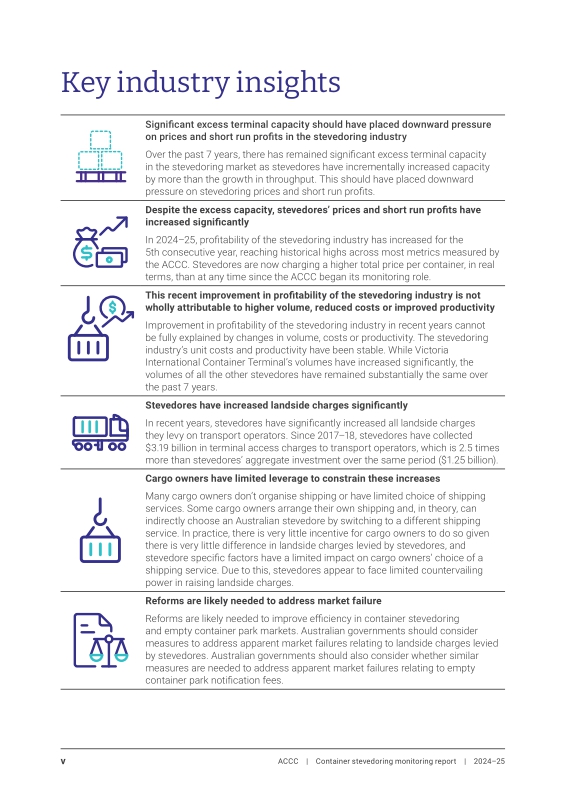
Key industry insights 5
Key results 2024-25 6
Executive summary 7
1. Introduction 20
1.1. The container freight supply chain in Australia 20
1.1.1. Australia's economy is heavily dependent on container trade 20
1.1.2. Productive and efficient operation of the container freight supply chain is critical 22
1.2. Participants in the container freight supply chain 23
1.2.1. Ports 24
1.2.2. Cargo owners 24
1.2.3. Stevedores 25
1.2.4. Shipping Lines 27
1.2.5. Transport operators 28
1.2.6. Empty container parks 28
1.2.7. Contractual relationships and flow of charges 28
1.3. The ACCC's monitoring program 31
1.3.1. The focus of the ACCC's monitoring 31
1.3.2. Steps the ACCC took in preparing this report 32
2. State of the supply chain 33
2.1. The impact of global events on container flows in 2024-25 33
2.1.1. Tariff uncertainty affected the flow of containers worldwide 34
2.1.2. Shipping lines continued to avoid the Red Sea in 2025 35
2.2. Vessel schedule reliability in 2024-25 35
2.2.1. Global vessel schedule reliability improved over 2024-25 35
2.2.2. Feedback suggests vessel schedule reliability in Australia remains low and has deteriorated 36
2.2.3. Local weather events appear to have reduced supply chain predictability further 37
2.3. Ocean freight rates in 2024-25 38
2.3.1. Global ocean freight rates were highly variable in 2024-25 38
2.3.2. Freight rates on key Australian import routes have also been volatile 39
2.4. Challenges reported by market participants 41
2.4.1. Many market participants raised concerns about stevedores' landside charges 41
2.4.2. Access to shipping, containers and slots a challenge for some market participants while others struggled to avoid detention fees 42
2.5. Enterprise agreements approved in 2025 44
3. Stevedoring competition and investment 45
3.1. Stevedoring competition 45
3.1.1. Stevedores compete directly for shipping line services 45
3.1.2. Stevedore specific factors largely have very limited impact on cargo owners' choice of a shipping service 51
3.1.3. Transparency of landside charges likely contributed to unusual landside charge practices 53
3.2. Stevedoring investment 56
3.2.1. Stevedores' investments are 'lumpy' and often long-lived 56
3.2.2. Observations on the size and nature of stevedores' investments 56
4. Stevedores' financial performance 61
4.1. The ACCC's financial performance metrics 62
4.1.1. The ACCC's expanded financial performance metrics 62
4.1.2. Using both monitoring financial data and statutory financial data to measure profitability 64
4.2. Terminal capacity in the stevedoring industry 65
4.3. Recent trends in unit revenue and costs 67
4.3.1. Background and methodology 67
4.3.2. Real total revenue per lift has increased significantly in the past few years while the total cost per lift to the stevedores is relatively stable 67
4.3.3. Stevedores' landside revenue has increased significantly in recent years 68
4.3.4. Stevedores' total costs per lift have been stable in the past 5 years, but have increased since 2016-17 70
4.4. Recent trends in operating profits and returns on average tangible assets 72
4.4.1. Background and methodology 72
4.4.2. Operating profit reached a new historical high 73
4.4.3. Operating profit margins reached a new historical high 74
4.4.4. Returns on average tangible assets reached a new historical high 76
4.5. Returns on average total assets 78
4.5.1. Background and methodology 78
4.5.2. Stevedoring industry EBIT-based return on average total assets has nearly doubled in 4 years 81
4.6. Domestic profitability benchmarking results 82
4.6.1. Background and methodology 82
4.6.2. The stevedoring industry has significantly outperformed both comparator sets on operating profit margins in the past 5 years 86
4.6.3. The relative performance of stevedoring industry's asset-based returns improved against both comparators 87
4.6.4. Consistent pattern across all 3 benchmarking results 90
4.7. ACCC observations on the financial performance of the stevedoring industry 91
4.7.1. Saw tooth pattern in capital intensive industries 91
4.7.2. Saw tooth pattern in the stevedoring industry 92
4.7.3. Elevated stevedoring profits are unlikely to be transient 93
5. Container stevedoring productivity 95
5.1. Reporting on container stevedoring productivity 96
5.2. Container stevedoring productivity results 98
5.2.1. Indicators of quayside stevedoring productivity 98
5.2.2. Indicators of landside stevedoring productivity 105
5.2.3. Broader indicators of port performance 110
5.2.4. Stevedoring industry productivity appears to have been relatively stable over the past 5 years 112
5.3. Potential improvements to the framework for measuring container port productivity 112
5.3.1. Key findings and recommendations from the Productivity Commission's Maritime Inquiry Report 113
5.3.2. There are some 'gaps' in the framework for measuring container port productivity 114
5.3.3. Enhancing container stevedoring productivity reporting in future monitoring reports 117
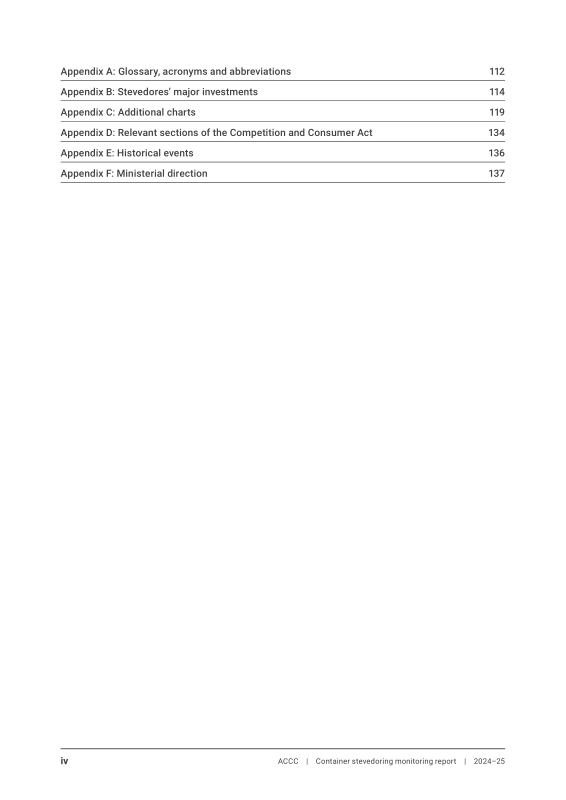
Appendix A: Glossary, acronyms and abbreviations 118
Appendix B: Stevedores' major investments 120
Appendix C: Additional charts 125
Appendix D: Relevant sections of the Competition and Consumer Act 140
Appendix E: Historical events 142
Appendix F: Ministerial direction 143
Tables 51
Table 3.1. Proportion of volume arranged by an Australian cargo owner, estimates from shipping lines 51
Table 3.2. Terminal access charges for full import containers at the Port of Melbourne 54
Table 4.1. Financial performance metrics and definitions 63
Table 4.2. Data sources and application of AASB 16 across profitability metrics 64
Table 4.3. Estimates of effective terminal capacity utilisation, by port: 2018-2024 66
Table 4.4. Average operating profit margins of the stevedoring industry and the 3 incumbents across multiple timeframes 75
Table 4.5. Average rates of return on average tangible assets of the industry and the 3 incumbents across multiple timeframes 78
Table 4.6. Adjustments to align additional profitability metrics with AASB16 80
Table 4.7. Summary of our considerations for the 3 approaches 83
Table 4.8. Average EBIT operating profit margins of the stevedoring industry and the comparators 87
Table 4.9. Average EBIT return on asset-related measures of the 4 comparator sets 90
Table 5.1. Annual average change in quayside productivity indicators, Australia: 1998-99 to 2024-25 100
Figures 21
Figure 1.1. Total annual throughput of Australia's 5 largest container ports: 2001-02 to 2024-25 21
Figure 1.2. Annual full container imports and exports (TEU) at Australia's 5 largest container ports: 2015-16 to 2024-25 22
Figure 1.3. Supply chain participants - imports and exports 23
Figure 1.4. Container stevedores in Australia's monitored port locations 27
Figure 1.5. Contractual relationships and flow of charges between parties in the supply chain when overseas cargo owners organise shipping 29
Figure 1.6. Contractual relationships and flow of charges between parties in the supply chain when Australian cargo owners organise shipping 30
Figure 2.1. Timeline of key tariff-related events: April 2025 to August 2025 34
Figure 2.2. Global vessel schedule reliability: September 2018 to September 2025 36
Figure 2.3. Platts Container Index ($US/40-foot equivalent unit), 2 January 2020 to 31 October 2025 39
Figure 2.4. Platts Container Rates ($US/40-foot equivalent unit) - Australian import routes: 27 September 2023 to 31 October 2025 40
Figure 3.1. Aggregate annual investment, stevedoring industry and 3 incumbents: 2006-07 to 2024-25 56
Figure 3.2. Extract from a Patrick Terminals' internal document 60
Figure 4.1. Total throughput, stevedoring industry & 3 incumbents: 2001-02 to 2024-25 65
Figure 4.2. Real total revenues per lift and real total costs per lift, industry & 3 incumbents: 2001-02 to 2024-25 68
Figure 4.3. 3 incumbents' real total revenues per lift, by source: 2001-02 to 2024-25 69
Figure 4.4. Annual change in 3 incumbents' real revenues per lift, by source: 2002-03 to 2024-25 70
Figure 4.5. Change in 3 incumbents' real total costs per lift, by component: 2002-03 to 2024-25 71
Figure 4.6. EBIT, EBITA and EBITDA operating profits of the 3 incumbents in real terms: 1998-99 to 2024-25 73
Figure 4.7. EBIT, EBITA and EBITDA operating profit margins of the 3 incumbents: 1998-99 to 2024-25 74
Figure 4.8. Returns on average tangible assets of the 3 incumbents: 2007-08 to 2024-25 77
Figure 4.9. Returns on average total assets of the stevedore industry adjusted for AASB 16: 2020-21 to 2024-25 81
Figure 4.10. EBIT operating profit margins benchmarking results: 2015-2024 86
Figure 4.11. EBIT return on invested capital (including goodwill) benchmarking results: 2015-2024 88
Figure 4.12. EBIT return on capital employed benchmarking results: 2015 to 2024 89
Figure 4.13. Extract from DP World's board paper 93
Figure 5.1. Quayside stevedoring productivity indicators, Australia: 1998-99 to 2024-25 99
Figure 5.2. Average net crane rate of the stevedores, by port: 1998-99 to 2024-25 101
Figure 5.3. Average net elapsed labour rate of the stevedores, by port: 1998-99 to 2024-25 101
Figure 5.4. Average net ship rate of the stevedores, by port: 1998-99 to 2024-25 102
Figure 5.5. Average container lifts per berth hour of the stevedores, by port: 2011-12 to 2024-25 104
Figure 5.6. Average truck turnaround times of the stevedores, by port: 2011-12 to 2024-25 106
Figure 5.7. Average truck utilisation, Australia: 2011-12 to 2024-25 107
Figure 5.8. Average container turnaround time of the stevedores, by port: 2011-12 to 2024-25 109
Figure 5.9. Median ship turnaround time, selected ports: September quarter 2011 to June quarter 2025 111
Figure 5.10. Median berth hours by port: September quarter 2011 to June quarter 2025 111
Boxes 59
Box 3.1. Case study on Patrick Terminals' recent investments 59
Box 4.1. Measures of terminal capacity in the container stevedoring sector 66
Box 4.2. Saw tooth pattern of profitability, as described by CEG 91
Box 5.1. Stevedores may be measuring truck turnaround time differently 108
Box 5.2. A summary of the Productivity Commission's key findings relating to container port productivity 113
Appendix Tables 120
Table B.1. Stevedores' major investments commenced or completed by financial year 120
Table C.1. Differences between the statutory financial reporting figures and the monitoring financial reporting figures 137
Table C.2. Number of sample companies in ACCC's broad comparator set 139
Table C.3. List of comparator companies by GICS sector and industry group in ACCC's narrower comparator set 139
Table E.1. Selection of historical events throughout the monitoring regime affecting stevedoring throughput, revenue and costs 142
Appendix Figures 125
Figure C.1. EBIT, EBITA and EBITDA operating profits of the stevedoring industry: 1998-99 to 2024-25 125
Figure C.2. EBIT, EBITA and EBITDA operating profit margins of the stevedoring industry: 1998-99 to 2024-25 125
Figure C.3. Returns on average tangible assets of the stevedoring industry: 2007-08 to 2024-25 126
Figure C.4. Tangible asset base, stevedoring industry & 3 incumbents: 2006-07 to 2024-25 126
Figure C.5. Stevedores' EBITDA operating profit margins in Melbourne, Sydney and Brisbane: 1998-99 to 2024-25 127
Figure C.6. Total industry revenues: 2001-02 to 2024-25 127
Figure C.7. Industry total revenues per lift: 2001-02 to 2024-25 128
Figure C.8. Industry total costs per lift: 2001-02 to 2024-25 128
Figure C.9. Industry total revenues per lift for full containers: 2017-18 to 2024-25 129
Figure C.10. Industry total revenues per lift for empty containers: 2017-18 to 2024-25 129
Figure C.11. Terminal access charges levied by stevedores in nominal dollars at each monitored port location: January 2017 to July 2025 130
Figure C.12. Average land rent per square metre, by port: 2017-18 to 2024-25 131
Figure C.13. Average property costs per lift, by port: 2001-02 to 2024-25 131
Figure C.14. Crane intensity by port: 2011-12 to 2024-25 132
Figure C.15. Twenty-foot equivalent units (TEU) per truck visit by port: 2011-12 to 2024-25 132
Figure C.16. Containers per truck visit by port: 2011-12 to 2024-25 133
Figure C.17. Average exchange size by port (20-foot equivalent units): 2011-12 to 2024-25 133
Figure C.18. Average exchange size by port (containers): 2011-12 to 2024-25 134
Figure C.19. Average number of vessel calls, Australia: 2011-12 to 2024-25 134
Figure C.20. Average annual number of vessel calls by port: 2011-12 to 2024-25 135
Figure C.21. Proportion of twenty-foot equivalent units (TEU) transported by rail, by port: 2011-12 to 2024-25 135
Figure C.22. Proportion of trucks that were 'backloaded' by port: 2013-14 to 2024-25 136
*표시는 필수 입력사항입니다.
| 전화번호 |
|---|
| 기사명 | 저자명 | 페이지 | 원문 | 기사목차 |
|---|
| 번호 | 발행일자 | 권호명 | 제본정보 | 자료실 | 원문 | 신청 페이지 |
|---|
도서위치안내: / 서가번호:

우편복사 목록담기를 완료하였습니다.
*표시는 필수 입력사항입니다.
저장 되었습니다.
