
 대표어
대표어
 https://www.wto.org/english/res_e/reser_e/ersd202602_e.htm
권호기사보기
| 기사명 | 저자명 | 페이지 | 원문 | 기사목차 |
|---|
결과 내 검색
동의어 포함
Title page 1
Contents 1
Abstract 1
Non-Technical Summary 2
1. Introduction 3
2. Literature Review 5
3. Gravity Estimation 7
4. Construction of Ad-Valorem Equivalent Shocks 11
5. Economic Model 16
5.1. Firms' Production 16
5.2. International Trade and Foreign Affiliate Sales 17
5.3. Allocation of Global Saving, FDI, and Trade Balance 17
6. Quantitative Findings 18
6.1. Foreign Affiliate Sales and Foreign Direct Investment Flows 18
6.2. GDP Impacts 25
6.3. Impact of FDI Productivity Spillover Mechanism 28
7. Conclusion 28
References 31
Appendix A. Sectoral and regional aggregations 34
Appendix B. Data Development 38
Appendix C. The Construction of the Sales Data 54
Appendix D. Additional Results for the Gravity 57
Appendix E. Model Description 60
Appendix F. Additional Quantitative Results 75
Tables 10
Table 1. Gravity Estimation Results 10
Figures 13
Figure 1. IFI Score Changes by economy 13
Figure 2. AVE Cost Reduction 14
Figure 3. Average AVE Cost Reduction by Income Group 15
Figure 4. Value Added Structure 17
Figure 5. Demand Structure 18
Figure 6. Saving Structure 19
Figure 7. Cumulative FAS changes 20
Figure 8. Cumulative changes in foreign affiliate sales by sector 21
Figure 9. Cumulative FDI inflow changes 22
Figure 10. Cumulative FDI outflow changes 23
Figure 11. Cumulative FDI flow changes 24
Figure 12. Cumulative GDP changes 25
Figure 13. Relationship between IFD shocks and GDP changes 26
Figure 14. Cumulative real income changes 27
Figure 15. Cumulative GDP changes when positive spillover is introduced 29
Appendix Tables 35
Table A.1. Aggregated regions, their descriptions, and corresponding economies 35
Table A.2. Allocation of Sectors to Broad Categories 36
Table A.3. Economy Abbreviations (used in Tables with projected IFI changes) 37
Table B.1. Dimensional Coverage Across FDI Stock and FAS Data Sources 39
Table B.2. Sector List with Concordance to GTAP Database and ISIC Revision 4 43
Table B.3. FDI Sector-by-Sector Gravity Estimation 44
Table B.4. FDI Sector-by-Sector Gravity Estimation (Continued) 45
Table B.5. FDI Sector-by-Sector Gravity Estimation (Continued) 46
Table B.6. FDI Sector-by-Sector Gravity Estimation (Continued) 47
Table B.7. Three-dimensional FATS Data, Breakdown by Methodology Flag 49
Table B.8. FAS Sector-by-Sector Gravity Estimation 50
Table B.9. FAS Sector-by-Sector Gravity Estimation (continued) 51
Table B.10. FAS Sector-by-Sector Gravity Estimation (continued) 52
Table B.11. FAS Sector-by-Sector Gravity Estimation (continued) 53
Table D.1. Cross-sector Gravity Estimation 58
Table D.2. Additional Robustness Tests Gravity Estimation 59
Table E.1. Overview taxes in the model 69
Table E.2. Model Parameterization 73
Appendix Figures 75
Figure F.1. Cumulative trade volume changes 75
Figure F.2. Cumulative FAS changes under spillover 76
Figure F.3. Cumulative FDI inflow changes under spillover 77
Figure F.4. Cumulative export volume changes under spillover 78
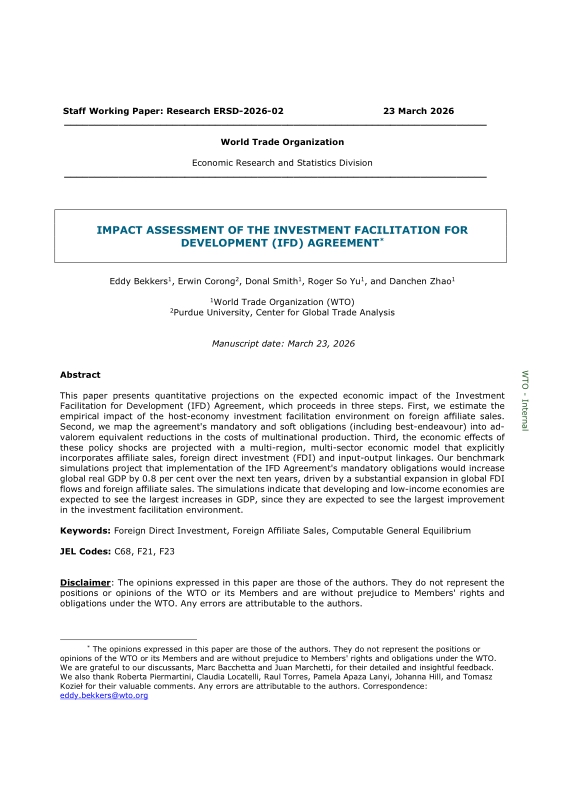
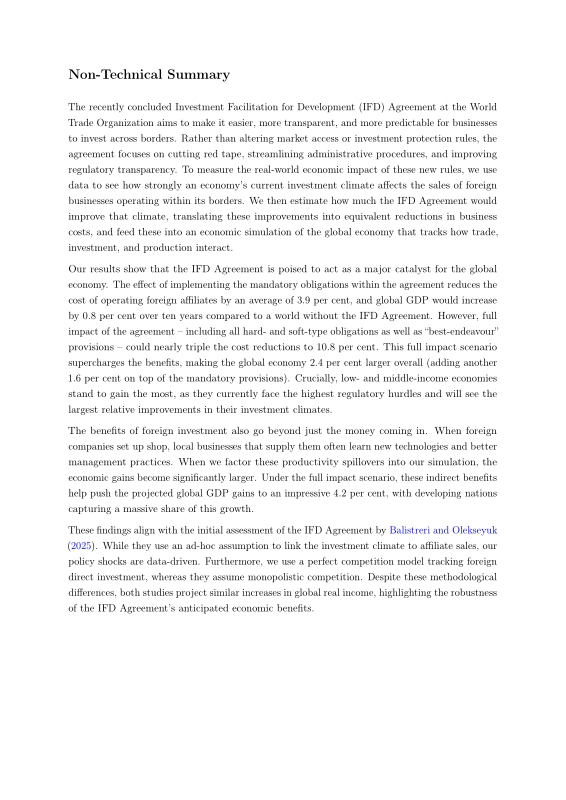
This paper presents quantitative projections on the expected economic impact of the Investment Facilitation for Development (IFD) Agreement, which proceeds in three steps.
First, we estimate the empirical impact of the host-economy investment facilitation environment on foreign affiliate sales.
Second, we map the agreement's mandatory and soft obligations (including best-endeavour) into ad-valorem equivalent reductions in the costs of multinational production.
Third, the economic effects of these policy shocks are projected with a multi-region, multi-sector economic model that explicitly incorporates affiliate sales, foreign direct investment (FDI) and input-output linkages.
Our benchmark simulations project that implementation of the IFD Agreement's mandatory obligations would increase global real GDP by 0.8 per cent over the next ten years, driven by a substantial expansion in global FDI flows and foreign affiliate sales.
The simulations indicate that developing and low-income economies are expected to see the largest increases in GDP, since they are expected to see the largest improvement in the investment facilitation environment.*표시는 필수 입력사항입니다.
| 전화번호 |
|---|
| 기사명 | 저자명 | 페이지 | 원문 | 기사목차 |
|---|
| 번호 | 발행일자 | 권호명 | 제본정보 | 자료실 | 원문 | 신청 페이지 |
|---|
도서위치안내: / 서가번호:

우편복사 목록담기를 완료하였습니다.
*표시는 필수 입력사항입니다.
저장 되었습니다.
