
 대표어
대표어
 https://www.accc.gov.au/about-us/publications/serial-publications/gas-inquiry-2017-30-reports/gas-inquiry-march-2026-interim-report

권호기사보기
| 기사명 | 저자명 | 페이지 | 원문 | 기사목차 |
|---|
결과 내 검색
동의어 포함
Title page 1
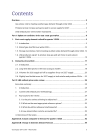
Contents 3
Acknowledgement of Country 2
Overview 5
Gas stores vital to meeting southern gas demand through winter 2026 5
Producer prices increase as buyers seek to secure supply for 2027 6
LNG netback price series will be maintained 6
Part 1: Update on conditions in the east coast gas market 8
1. East coast supply-demand outlook for quarter 3 2026 9
1.1. Introduction 9
1.2. Risk of gas shortfall over winter 2026 10
1.3. Storage inventories vital to meeting southern state demand through winter 2026 12
1.4. LNG producers expect to produce less gas and sell more in spot sales in quarter 3 2026 15
2. Domestic price outlook 17
2.1. Introduction 17
2.2. Long-term GSA prices in the east coast gas market 18
2.3. Volumes for 2026 supply tail off as suppliers focus on 2027 supply 20
2.4. Slightly less flexible terms for 2027 supply in both retailer and producer GSAs 22
Part 2: LNG netback price series review 24
Executive summary 25
1. Introduction 25
2. Current LNG netback price methodology 27
3. Key issues for the review 29
3.1. Is the price series achieving its objectives? 29
3.2. What are the most appropriate reference prices? 32
3.3. What should the reference timeframes be? 36
3.4. How should other costs be accounted for? 39
4. Outcomes of the review 40
Appendix A: Actuals compared to forecast for quarter 3 2025 42
Appendix B: Change in domestic demand forecast 44
Appendix C: Approach to reporting on GSA prices 46
Glossary 47
Tables 16
Table 1.1. LNG producers' updated forecasts for quarter 3 2026 (PJ) 16
Table 2.1. Producer and retailer GSAs by pricing mechanism, agreed between Oct and Dec 2025 20
Table 2.2. Count and volumes of long-term GSAs for supply in 2026 and 2027 21
Figures 28
Figure 1. Stylised example of how LNG prices are netted back 28
Boxes 26
Box 1. What are LNG netback prices? 26
Box 2. Report from FTI Consulting 26
Box 3. Submissions to the review 27
Box 4. Current reference prices and timeframes 28
Box 5. Incremental costs for LNG supply 29
Box 6. Formula for calculating LNG netback prices 29
Box 7. Consultation question on objectives 29
Box 8. Consultation questions on reference prices 32
Box 9. Consultation questions on reference timeframes 36
Box 10. Consultation questions on other considerations 39
Box 11. Outcomes of the LNG netback price series review 41
Charts 11
Chart 1.1. Supply-demand outlook for April to September 2026 (PJ) 11
Chart 1.2. Reasons for change in quarter 3 2026 supply-demand outlook (December 2025-March 2026) 12
Chart 1.3. Southern states supply-demand outlook for April to September 2026 (PJ) 13
Chart 1.4. Year-on-year Iona underground storage levels 14
Chart 1.5. Year-on-year flows on the South-West Queensland Pipeline 15
Chart 2.1. Gas commodity prices in the east coast gas market for 2026 supply 18
Chart 2.2. Gas commodity prices in the east coast gas market for 2027 supply 19
Chart 2.3. Cumulative volumes contracted under long-term GSAs for supply years 2021-2027 21
Chart 2.4. GSA take-or-pay multipliers and load factors for supply in 2026 and 2027 23
Appendix Tables 42
Table A.1. Comparison of forecast vs actuals for Q3 2025 (PJ) 42
Appendix Charts 44
Chart B.1. Forecast GPG demand higher in most quarters of 2026 (PJ)22 44
Chart B.2. Residential, commercial and industrial demand forecasts lower in 2026 due to falling demand from industrial users and increased electrification (PJ) 45
*표시는 필수 입력사항입니다.
| 전화번호 |
|---|
| 기사명 | 저자명 | 페이지 | 원문 | 기사목차 |
|---|
| 번호 | 발행일자 | 권호명 | 제본정보 | 자료실 | 원문 | 신청 페이지 |
|---|
도서위치안내: / 서가번호:

우편복사 목록담기를 완료하였습니다.
*표시는 필수 입력사항입니다.
저장 되었습니다.
