
 대표어
대표어
 https://documents.worldbank.org/en/publication/documents-reports/documentdetail/099042926035539735
권호기사보기
| 기사명 | 저자명 | 페이지 | 원문 | 기사목차 |
|---|
결과 내 검색
동의어 포함
Title page 1
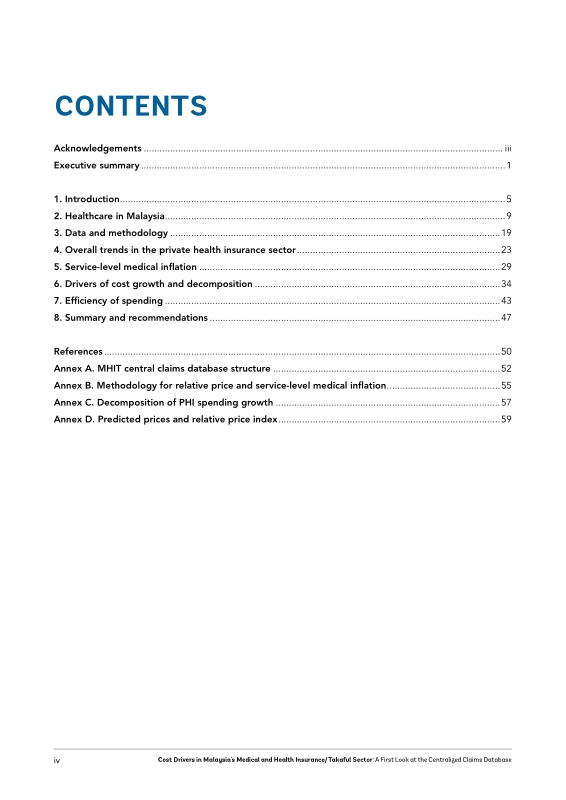
Contents 4
Acknowledgements 3
Executive summary 7
1. Introduction 11
2. Healthcare in Malaysia 15
3. Data and methodology 25
4. Overall trends in the private health insurance sector 29
5. Service-level medical inflation 35
6. Drivers of cost growth and decomposition 40
7. Efficiency of spending 49
8. Summary and recommendations 53
References 56
Annex A. MHIT central claims database structure 58
Annex B. Methodology for relative price and service-level medical inflation 61
Annex C. Decomposition of PHI spending growth 63
Annex D. Predicted prices and relative price index 65
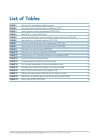
FIGURE 1. Trends in Disability-Adjusted Life Years (DALYs) 4 by cause, 1990-2023 16
FIGURE 2. Premature mortality from non-communicable diseases (NCDs) by income level, 2021 17
FIGURE 3. Population aged 65+ years, 2010-2040 17
FIGURE 4. Health expenditure as a share of GDP, 2023 18
FIGURE 5. Current health expenditure per capita (in USD), 2023 19
FIGURE 6. Current health expenditure for voluntary health insurance, 2023 19
FIGURE 7. Health expenditure at all hospitals by sources of financing, 2023 20
FIGURE 8. Private health insurance coverage, 2018-2024 21
FIGURE 9. Key strategies under RESET 23
FIGURE 10. Distribution of claims and total bill by age group, 2022-2024 33
FIGURE 11. Average number of claims by age groups, 2022-2024 34
FIGURE 12. Average claims paid amount by age groups, 2022-2024 34
FIGURE 13. Results of decomposition analysis 43
FIGURE 14. Average cost per claim by age and sex (Inpatient) 46
FIGURE 15. Total billed amount for cashless and non-cashless claims 48
FIGURE 16. Share of ACSC to total inpatient admissions 50
FIGURE 17. Distribution of share of ACSC across facilities 51
FIGURE 18. Average length of stay (ALOS) in top 50 hospitals 52
FIGURE 19. ALOS by hospital size (proxied by number of claims) 52
*표시는 필수 입력사항입니다.
| 전화번호 |
|---|
| 기사명 | 저자명 | 페이지 | 원문 | 기사목차 |
|---|
| 번호 | 발행일자 | 권호명 | 제본정보 | 자료실 | 원문 | 신청 페이지 |
|---|
도서위치안내: / 서가번호:

우편복사 목록담기를 완료하였습니다.
*표시는 필수 입력사항입니다.
저장 되었습니다.
