
 대표어
대표어
 https://op.europa.eu/en/publication-detail/-/publication/002a7300-404c-11f1-8095-01aa75ed71a1/language-en?WT.mc_id=Selectedpublications&WT.ria_c=41957&WT.ria_f=6415&WT.ria_ev=search


권호기사보기
| 기사명 | 저자명 | 페이지 | 원문 | 기사목차 |
|---|
결과 내 검색
동의어 포함
Title page 1
Contents 3
Abstract 4
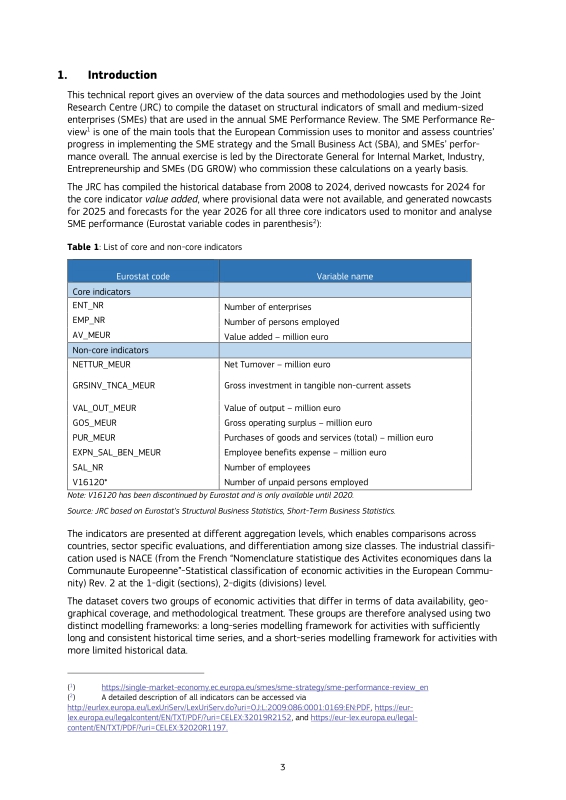
1. Introduction 5
2. Detailed country sources 8
2.1. Primary source of historical data delivered 8
2.1.1. EU-27 8
2.1.2. Non-EU countries 11
3. Long-series model for NACE sections B-J, L-N, and S95 14
3.1. Historical data estimation and harmonisation (long-series model) 14
3.2. Nowcasting methodology (2024-2025) 16
3.3. Forecasting methodology (2026) 19
4. Short-series modelling framework (MF-DFM) for selected NACE codes 21
4.1. Secondary data sources 21
4.2. Data preparation and preprocessing 22
4.2.1. Partitioning into system classes 22
4.2.2. Treatment of missing, zero, and problematic data 24
4.3. Nowcasting methodology (2024-2025) 25
4.3.1. Model initialisation 25
4.3.2. EM algorithm 26
4.3.3. Generating nowcasts 26
4.4. Forecasting methodology 2026 27
5. Conceptual validation checks 28
6. Inflation adjustment 30
7. Model accuracy 31
7.1. Long-series model for NACE sections B-J, L-N, and S95 31
8. Conclusions and future developments 35
References 37
List of abbreviations and definitions 38
Annex 41
Figure 1. The Median Absolute Percentage Errors (MdAPE) of number of enterprises using 2021-2023 data by NACE Rev.2 breakdown,... 34
Figure 2. The Median Absolute Percentage Errors (MdAPE) of value added using 2021-2023 data by NACE Rev.2 breakdown,... 34
Figure 3. The Median Absolute Percentage Errors (MdAPE) of persons employed using 2021-2023 data by NACE Rev.2 breakdown,... 34
*표시는 필수 입력사항입니다.
| 전화번호 |
|---|
| 기사명 | 저자명 | 페이지 | 원문 | 기사목차 |
|---|
| 번호 | 발행일자 | 권호명 | 제본정보 | 자료실 | 원문 | 신청 페이지 |
|---|
도서위치안내: / 서가번호:

우편복사 목록담기를 완료하였습니다.
*표시는 필수 입력사항입니다.
저장 되었습니다.
