
 대표어
대표어
 https://documents.worldbank.org/en/publication/documents-reports/documentdetail/099060426001524962

권호기사보기
| 기사명 | 저자명 | 페이지 | 원문 | 기사목차 |
|---|
결과 내 검색
동의어 포함
Title page 1
Contents 3
Acknowledgments 7
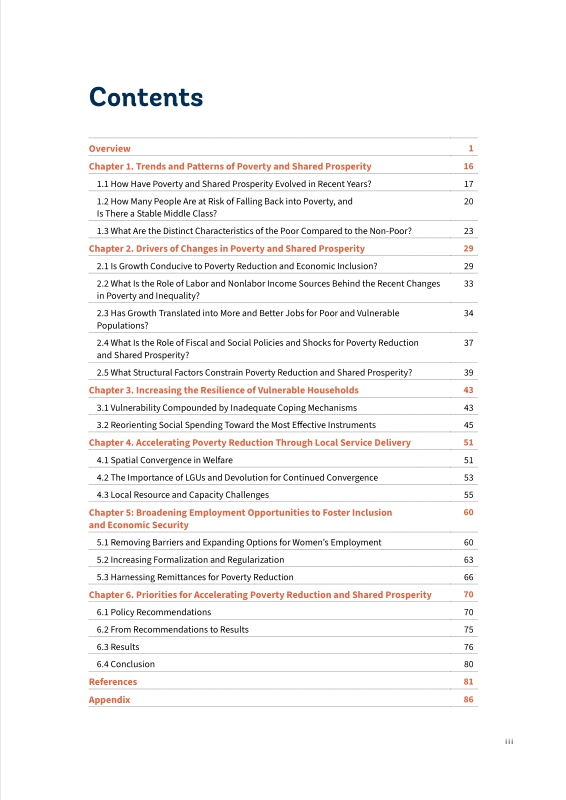
Overview 11
CHAPTER 1. Trends and Patterns of Poverty and Shared Prosperity 26
1.1. How Have Poverty and Shared Prosperity Evolved in Recent Years? 27
1.2. How Many People Are at Risk of Falling Back into Poverty, and Is There a Stable Middle Class? 30
1.3. What Are the Distinct Characteristics of the Poor Compared to the Non-Poor? 33
CHAPTER 2. Drivers of Changes in Poverty and Shared Prosperity 39
2.1. Is Growth Conducive to Poverty Reduction and Economic Inclusion? 39
2.2. What Is the Role of Labor and Nonlabor Income Sources Behind the Recent Changes in Poverty and Inequality? 43
2.3. Has Growth Translated into More and Better Jobs for Poor and Vulnerable Populations? 44
2.4. What Is the Role of Fiscal and Social Policies and Shocks for Poverty Reduction and Shared Prosperity? 47
2.5. What Structural Factors Constrain Poverty Reduction and Shared Prosperity? 49
CHAPTER 3. Increasing the Resilience of Vulnerable Households 53
3.1. Vulnerability Compounded by Inadequate Coping Mechanisms 53
3.2. Reorienting Social Spending Toward the Most Effective Instruments 55
CHAPTER 4. Accelerating Poverty Reduction Through Local Service Delivery 61
4.1. Spatial Convergence in Welfare 61
4.2. The Importance of LGUs and Devolution for Continued Convergence 63
4.3. Local Resource and Capacity Challenges 65
CHAPTER 5. Broadening Employment Opportunities to Foster Inclusion and Economic Security 70
5.1. Removing Barriers and Expanding Options for Women's Employment 70
5.2. Increasing Formalization and Regularization 73
5.3. Harnessing Remittances for Poverty Reduction 76
CHAPTER 6. Priorities for Accelerating Poverty Reduction and Shared Prosperity 80
6.1. Policy Recommendations 80
6.2. From Recommendations to Results 85
6.3. Results 86
6.4. Conclusion 90
References 91
APPENDIX A. Key Poverty and Shared Prosperity Indicators 96
APPENDIX B. Technical Annex 102
APPENDIX C. National Data Gap Assessment 105
APPENDIX D. Growth, Jobs and Equity Reforms 111
APPENDIX E. Modeling Assumptions for the Policy Scenarios 112
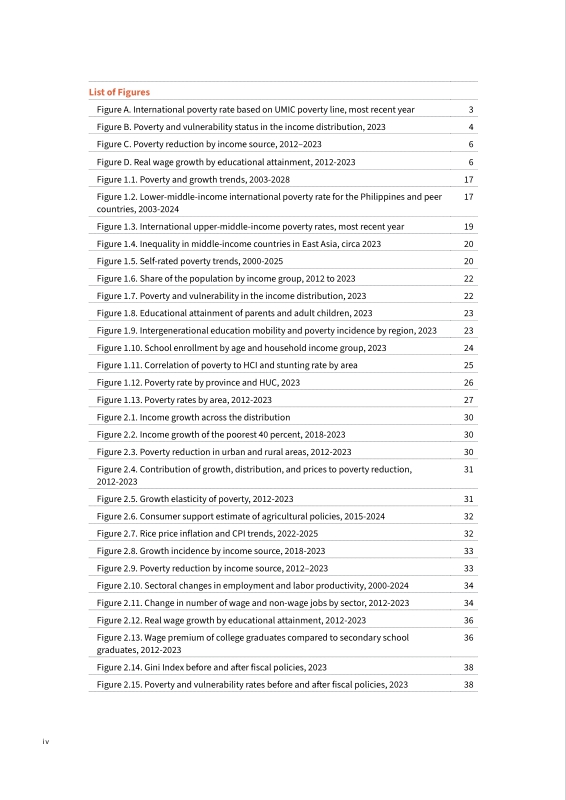
FIGURE A. International poverty rate based on UMIC poverty line, most recent year 13
FIGURE B. Poverty and vulnerability status in the income distribution, 2023 14
FIGURE C. Poverty reduction by income source, 2012-2023 16
FIGURE D. Real wage growth by educational attainment, 2012-2023 16
FIGURE 1.1. Poverty and growth trends, 2003-2028 27
FIGURE 1.2. Lower-middle-income international poverty rate for the Philippines and peer countries, 2003-2024 27
FIGURE 1.3. International upper-middle-income poverty rates, most recent year 29
FIGURE 1.4. Inequality in middle-income countries in East Asia, circa 2023 30
FIGURE 1.5. Self-rated poverty trends, 2000-2025 30
FIGURE 1.6. Share of the population by income group, 2012 to 2023 32
FIGURE 1.7. Poverty and vulnerability in the income distribution, 2023 32
FIGURE 1.8. Educational attainment of parents and adult children, 2023 33
FIGURE 1.9. Intergenerational education mobility and poverty incidence by region, 2023 33
FIGURE 1.10. School enrollment by age and household income group, 2023 34
FIGURE 1.11. Correlation of poverty to HCI and stunting rate by area 35
FIGURE 1.12. Poverty rate by province and HUC, 2023 36
FIGURE 1.13. Poverty rates by area, 2012-2023 37
FIGURE 2.1. Income growth across the distribution 40
FIGURE 2.2. Income growth of the poorest 40 percent, 2018-2023 40
FIGURE 2.3. Poverty reduction in urban and rural areas, 2012-2023 40
FIGURE 2.4. Contribution of growth, distribution, and prices to poverty reduction, 2012-2023 41
FIGURE 2.5. Growth elasticity of poverty, 2012-2023 41
FIGURE 2.6. Consumer support estimate of agricultural policies, 2015-2024 42
FIGURE 2.7. Rice price inflation and CPI trends, 2022-2025 42
FIGURE 2.8. Growth incidence by income source, 2018-2023 43
FIGURE 2.9. Poverty reduction by income source, 2012-2023 43
FIGURE 2.10. Sectoral changes in employment and labor productivity, 2000-2024 44
FIGURE 2.11. Change in number of wage and non-wage jobs by sector, 2012-2023 44
FIGURE 2.12. Real wage growth by educational attainment, 2012-2023 46
FIGURE 2.13. Wage premium of college graduates compared to secondary school 46
FIGURE 2.14. Gini Index before and after fiscal policies, 2023 48
FIGURE 2.15. Poverty and vulnerability rates before and after fiscal policies, 2023 48
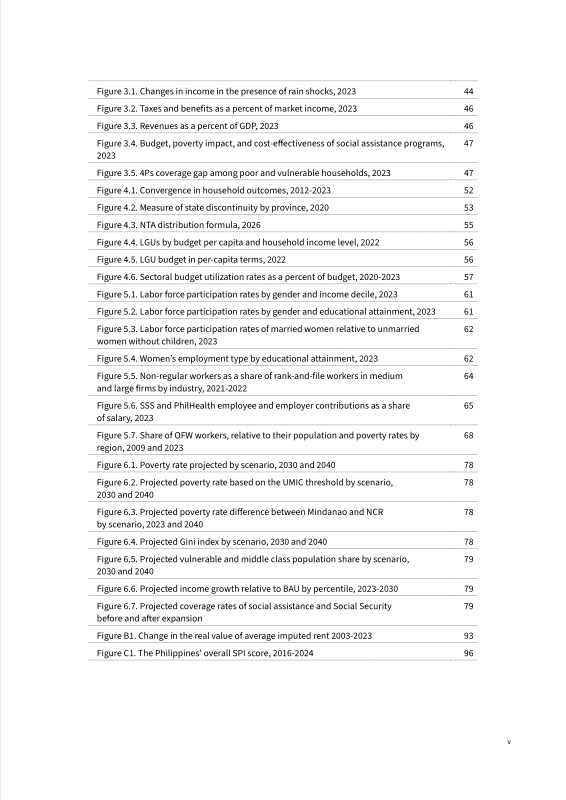
FIGURE 3.1. Changes in income in the presence of rain shocks, 2023 54
FIGURE 3.2. Taxes and benefits as a percent of market income, 2023 56
FIGURE 3.3. Revenues as a percent of GDP, 2023 56
FIGURE 3.4. Budget, poverty impact, and cost-effectiveness of social assistance programs, 2023 57
FIGURE 3.5. 4Ps coverage gap among poor and vulnerable households, 2023 57
FIGURE 4.1. Convergence in household outcomes, 2012-2023 62
FIGURE 4.2. Measure of state discontinuity by province, 2020 63
FIGURE 4.3. NTA distribution formula, 2026 65
FIGURE 4.4. LGUs by budget per capita and household income level, 2022 66
FIGURE 4.5. LGU budget in per-capita terms, 2022 66
FIGURE 4.6. Sectoral budget utilization rates as a percent of budget, 2020-2023 67
FIGURE 5.1. Labor force participation rates by gender and income decile, 2023 71
FIGURE 5.2. Labor force participation rates by gender and educational attainment, 2023 71
FIGURE 5.3. Labor force participation rates of married women relative to unmarried women without children, 2023 72
FIGURE 5.4. Women's employment type by educational attainment, 2023 72
FIGURE 5.5. Non-regular workers as a share of rank-and-file workers in medium and large firms by industry, 2021-2022 74
FIGURE 5.6. SSS and PhilHealth employee and employer contributions as a share of salary, 2023 75
FIGURE 5.7. Share of OFW workers, relative to their population and poverty rates by region, 2009 and 2023 78
FIGURE 6.1. Poverty rate projected by scenario, 2030 and 2040 88
FIGURE 6.2. Projected poverty rate based on the UMIC threshold by scenario, 2030 and 2040 88
FIGURE 6.3. Projected poverty rate difference between Mindanao and NCR by scenario, 2023 and 2040 88
FIGURE 6.4. Projected Gini index by scenario, 2030 and 2040 88
FIGURE 6.5. Projected vulnerable and middle class population share by scenario, 2030 and 2040 89
FIGURE 6.6. Projected income growth relative to BAU by percentile, 2023-2030 89
FIGURE 6.7. Projected coverage rates of social assistance and Social Security before and after expansion 89
Boxes 6
BOX 1. Profile of poverty and vulnerability 12
BOX 1.1. Beyond poverty measurement: Defining income groups 31
BOX 1.2. Strong absolute intergenerational mobility, but limited relative mobility 33
BOX 1.3. Conflict and recent peace dividends 37
BOX 2.1. Food prices as a source of vulnerability 42
BOX 4.1. Subnational spending data 64
BOX 5.1. Trade-offs of remittance-driven development 77
BOX 6.1. Limited data access as a bottleneck to policy implementation 81
FIGURE B1. Change in the real value of average imputed rent 2003-2023 103
FIGURE C1. The Philippines' overall SPI score, 2016-2024 106
*표시는 필수 입력사항입니다.
| 전화번호 |
|---|
| 기사명 | 저자명 | 페이지 | 원문 | 기사목차 |
|---|
| 번호 | 발행일자 | 권호명 | 제본정보 | 자료실 | 원문 | 신청 페이지 |
|---|
도서위치안내: / 서가번호:

우편복사 목록담기를 완료하였습니다.
*표시는 필수 입력사항입니다.
저장 되었습니다.
