
 대표어
대표어
 https://www.accc.gov.au/about-us/publications/serial-publications/domestic-airline-competition-monitoring-reports/domestic-airline-competition-in-australia-june-2026



권호기사보기
| 기사명 | 저자명 | 페이지 | 원문 | 기사목차 |
|---|
결과 내 검색
동의어 포함
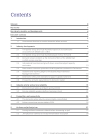
Title page 1
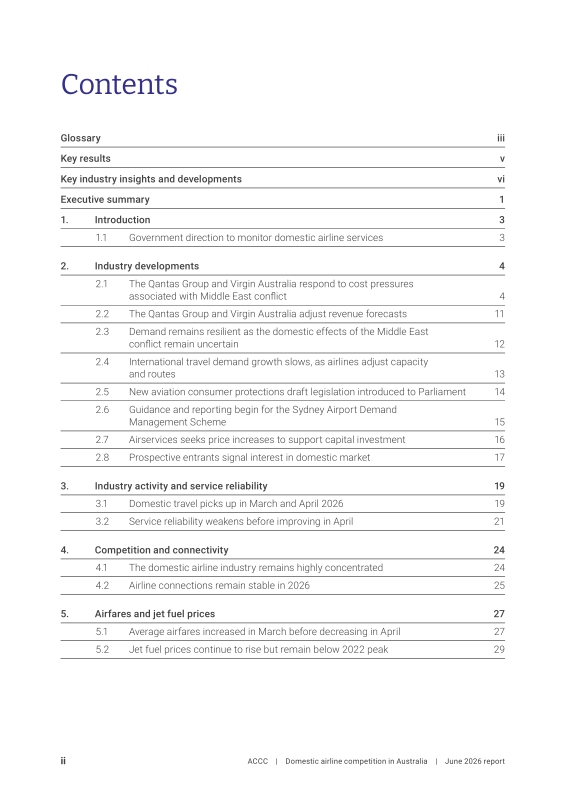
Contents 3
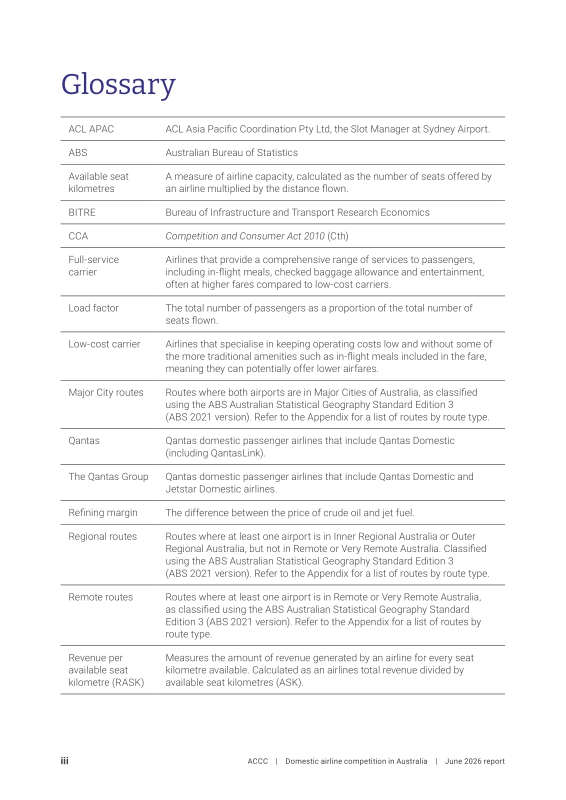
Glossary 4
Key results 6
Key industry insights and developments 7
Executive summary 8
1. Introduction 10
1.1. Government direction to monitor domestic airline services 10
2. Industry developments 11
2.1. The Qantas Group and Virgin Australia respond to cost pressures associated with Middle East conflict 11
2.2. The Qantas Group and Virgin Australia adjust revenue forecasts 18
2.3. Demand remains resilient as the domestic effects of the Middle East conflict remain uncertain 19
2.4. International travel demand growth slows, as airlines adjust capacity and routes 20
2.5. New aviation consumer protections draft legislation introduced to Parliament 21
2.6. Guidance and reporting begin for the Sydney Airport Demand Management Scheme 22
2.7. Airservices seeks price increases to support capital investment 23
2.8. Prospective entrants signal interest in domestic market 24
3. Industry activity and service reliability 26
3.1. Domestic travel picks up in March and April 2026 26
3.2. Service reliability weakens before improving in April 28
4. Competition and connectivity 31
4.1. The domestic airline industry remains highly concentrated 31
4.2. Airline connections remain stable in 2026 32
4.2.1. Consumer choice is more limited on Regional and Remote routes than Major City routes 33
5. Airfares and jet fuel prices 34
5.1. Average airfares increased in March before decreasing in April 34
5.2. Jet fuel prices continue to rise but remain below 2022 peak 36
Figure 1. Nominal weekly average Brent crude oil and jet fuel prices (A$) - January 2026 to June 2026 12
Figure 2. Monthly passenger levels and seat capacity - 2019, 2024, 2025 and 2026 26
Figure 3. Passenger levels on routes connecting larger cities - April 2019, 2025 and 2026 28
Figure 4. Airline on-time performance rates (arrivals) - April 2024 to April 2026 29
Figure 5. Airline cancellation rates - April 2024 to April 2026 30
Figure 6. Share of passengers serviced by airline across all domestic routes - April 2024 to April 2026 31
Figure 7. Number of domestic routes operated by airlines - April 2023 to April 2026 32
Figure 8. Index of real average fare revenue per passenger - January to December 2019, 2024, 2025 and 2026 34
Figure 9. Index of real average fare revenue per passenger by route type - January 2019 to April 2026 35
Figure 10. BITRE real cheapest airfare index, by airfare type - January 2019 to April 2026 36
Figure 11. Real monthly average jet fuel and Brent crude oil prices (A$) - January 2019 to April 2026 37
Boxes 14
Box 1. Regional airlines and low-cost carriers are particularly vulnerable to increased jet fuel prices 14
*표시는 필수 입력사항입니다.
| 전화번호 |
|---|
| 기사명 | 저자명 | 페이지 | 원문 | 기사목차 |
|---|
| 번호 | 발행일자 | 권호명 | 제본정보 | 자료실 | 원문 | 신청 페이지 |
|---|
도서위치안내: / 서가번호:

우편복사 목록담기를 완료하였습니다.
*표시는 필수 입력사항입니다.
저장 되었습니다.
