
 대표어
대표어
 https://openknowledge.worldbank.org/entities/publication/edc6d0d3-8c2b-4ba5-8c84-b629f72dc40a
권호기사보기
| 기사명 | 저자명 | 페이지 | 원문 | 기사목차 |
|---|
결과 내 검색
동의어 포함
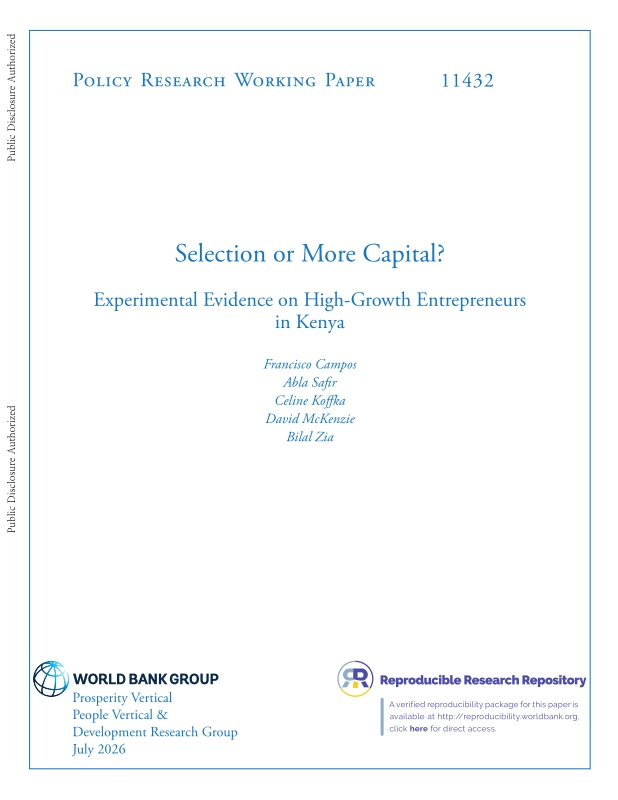
Title page 1
Contents 1
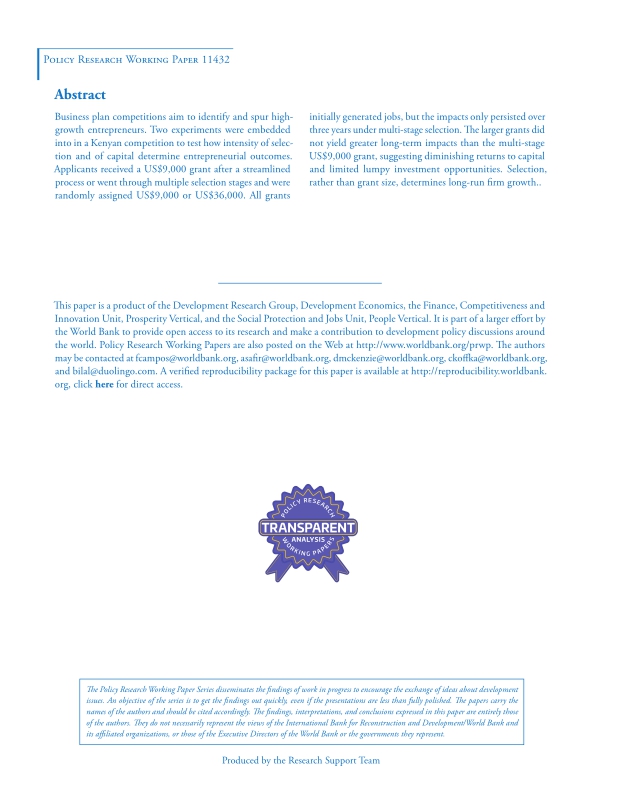
Abstract 2
1. Introduction 4
2. The Business Plan Competition 8
2.1. MbeleNaBiz 8
2.2. Streamlined Selection Process 10
2.3. Multi-Stage Selection Process 10
2.4. Grant Size Experiment 12
2.5. Implementation 12
2.6. Verification of Randomization and Comparison of Firms Selected in Streamlined versus Multi-Stage Process 12
3. Measuring Impacts 14
3.1. Data Collection 14
3.2. Estimation of Treatment Impacts 15
3.3. Dealing with Survey Attrition 16
4. Impacts on Firm Operation, Employment, and Firm Performance 17
4.1. What does theory predict we should see? 17
4.2. Empirical Impacts 20
4.2.1. Impacts on Jobs 20
4.2.2. Impacts on Firm Performance 22
4.2.3. Robustness of Main Results to Attrition 23
4.3. Heterogeneity in Treatment Impacts 24
4.4. Job Creation and Cost Effectiveness 26
5. Why Do We See These Impacts? 26
5.1. Did the way the grant was spent and invested differ across groups? 26
5.2. Do observable characteristics explain the differences in 9K grant impacts? 30
6. Conclusion 32
7. References 33
Appendices 49
A. Timeline 49
B. Business Plan Training 56
C. Robustness to Attrition 57
D. Measurement of Key Outcomes 60
E. Impacts on Secondary Firm Performance Outcomes 64
F. Additional Tables and Figures on Mechanisms 67
Figure 1. Impact Evaluation Process 46
Figure 2. Quantile Treatment Effects (3-year follow-up survey) 47
Figure 3. Grant Expenditure by Treatment Group (원문불량) 48
Figure F1. Correlation Application Score vs Multi-stage judge Score 67
*표시는 필수 입력사항입니다.
| 전화번호 |
|---|
| 기사명 | 저자명 | 페이지 | 원문 | 기사목차 |
|---|
| 번호 | 발행일자 | 권호명 | 제본정보 | 자료실 | 원문 | 신청 페이지 |
|---|
도서위치안내: / 서가번호:

우편복사 목록담기를 완료하였습니다.
*표시는 필수 입력사항입니다.
저장 되었습니다.
