
 대표어
대표어
 https://www.wto.org/english/res_e/publications_e/digital-trade-in-latin-america-and-the-caribbean_e.htm


권호기사보기
| 기사명 | 저자명 | 페이지 | 원문 | 기사목차 |
|---|
결과 내 검색
동의어 포함
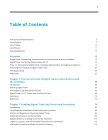
Title page 1
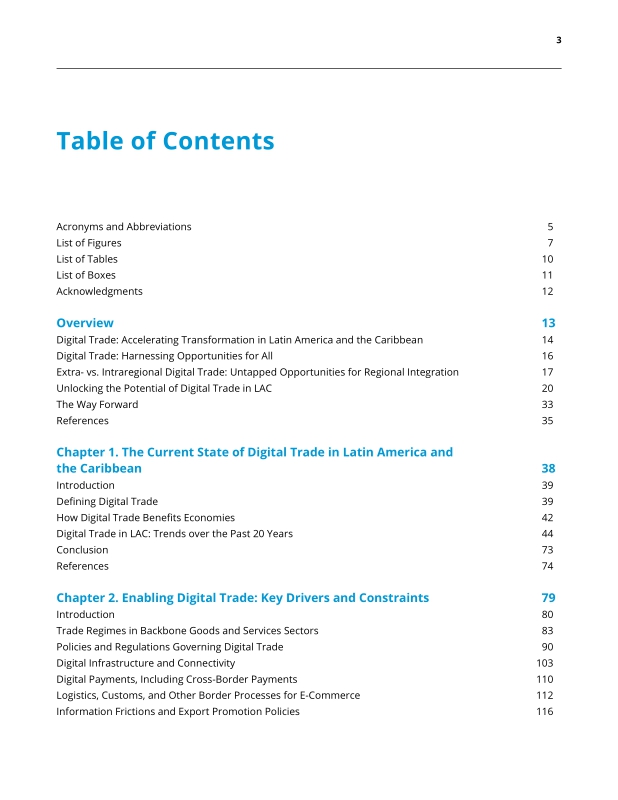
Contents 3
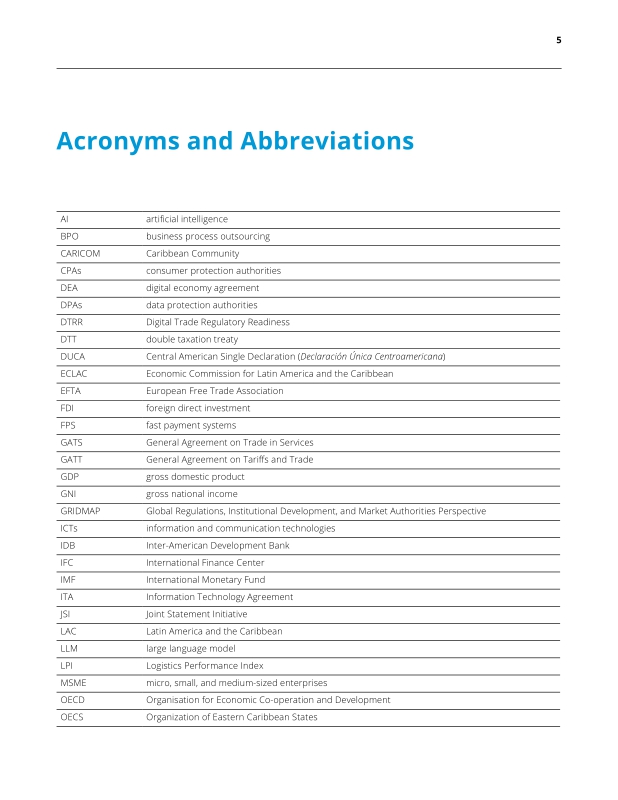
Acronyms and Abbreviations 5
Acknowledgments 12
Overview 13
Digital Trade: Accelerating Transformation in Latin America and the Caribbean 14
Digital trade: Harnessing opportunities for all 16
Extra- vs. intraregional digital trade: Untapped opportunities for regional integration 17
Unlocking the potential of digital trade in LAC 20
The way forward 33
References 35
Chapter 1. The Current State of Digital Trade in Latin America and the Caribbean 38
Introduction 39
Defining digital trade 39
How digital trade benefits economies 42
Digital trade in LAC: Trends over the past 20 years 44
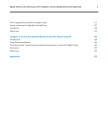
Conclusion 73
References 74
Chapter 2. Enabling Digital Trade: Key Drivers and Constraints 79
Introduction 80
Trade regimes in backbone goods and services sectors 83
Policies and regulations governing digital trade 90
Digital infrastructure and connectivity 103
Digital payments, including cross-border payments 110
Logistics, customs, and other border processes for e-commerce 112
Information frictions and export promotion policies 116
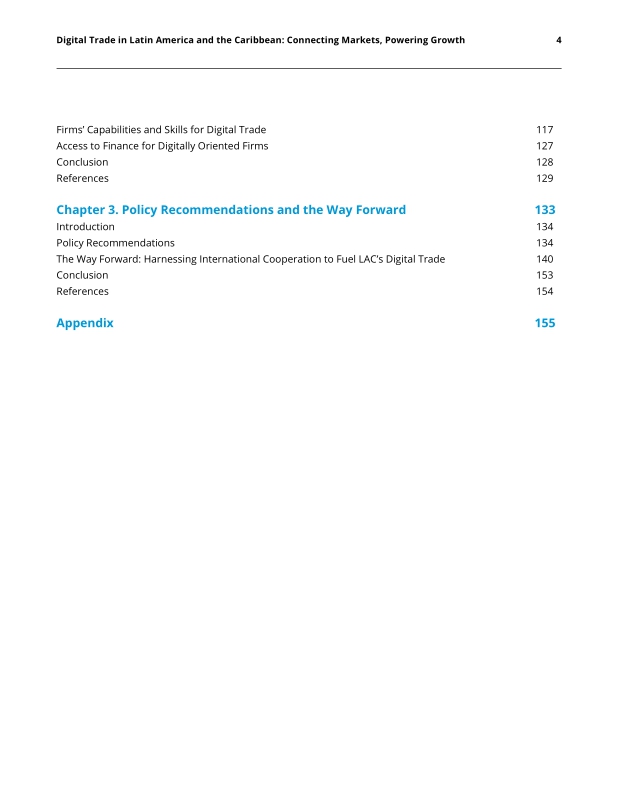
Firms' capabilities and skills for digital trade 117
Access to finance for digitally oriented firms 127
Conclusion 128
References 129
Chapter 3. Policy Recommendations and the Way Forward 133
Introduction 134
Policy recommendations 134
The way forward: Harnessing international cooperation to fuel LAC's digital trade 140
Conclusion 153
References 154
Appendix 155
FIGURE O.1. Digitally delivered services exports in LAC countries, 2005-2024 15
FIGURE O.2. Share of intraregional digitally deliverable services exports in total digitally deliverable services exports, 2023 18
FIGURE O.3. Key sources and destinations of inbound and outbound web traffic to LAC e-commerce platforms, 2023 19
FIGURE O.4. Fixed-line, mobile, and computer services trade restrictions indexes for LAC countries 21
FIGURE O.5. Regulatory readiness for digital trade in LAC 23
FIGURE O.6. Share of population using the internet in LAC, 2024 26
FIGURE O.7. Share of STEM graduates over all tertiary graduates by region and STEM category, 2021 31
FIGURE O.8. Number of digital businesses relative to population and GDP per capita in LAC, 2022-2024 32
FIGURE 1.1. Digitally delivered services exports in LAC countries, 2005-2024 44
FIGURE 1.2. Growth of LAC's digitally delivered services, other services, and goods exports, 2005-2024 (index 2005 = 100) 45
FIGURE 1.3. Share of digitally delivered services in services exports by country, 2005 vs. 2024 (% share) 46
FIGURE 1.4. Digitally delivered services exports by country, 2024 (% of GDP) 47
FIGURE 1.5. Digitally delivered services exports by region, 2005-2024 (billions of US$ and % shares) 57
FIGURE 1.6. Structure of LAC's exports of digitally delivered services, 2005 and 2024 (% shares) 57
FIGURE 1.7. Share of information and communication industry value-added in LAC manufacturing and services gross exports 59
FIGURE 1.8. LAC trade balance in digitally delivered services, 2005-2024 60
FIGURE 1.9. Share of traffic originating abroad on e-commerce platforms in LAC, 2019 and 2023 (% shares) 61
FIGURE 1.10. Share of intraregional digitally deliverable services exports in total digitally deliverable services exports, 2023 65
FIGURE 1.11. Share of digitally deliverable services trade across LAC's top 10 trade partners, 2023 (% shares) 66
FIGURE 1.12. Exports of digitally deliverable services of subregional blocs to LAC, 2023 (% share in LAC total) 67
FIGURE 1.13. Share of subregional and other intra-LAC exports in total digitally deliverable services exports, 2023 (% shares) 68
FIGURE 1.14. Key sources and destinations of inbound and outbound LAC e-commerce traffic, 2023 (% shares) 70
FIGURE 1.15. Direction of LAC economies' cross-border website traffic by region, 2023 (% shares) 72
FIGURE 2.1. Average most-favored-nation applied duties on ICT goods in LAC, 2024 83
FIGURE 2.2. Average most-favored-nation bound duties on ICT goods in LAC, 2024 84
FIGURES 2.3. Openness of digital trade-enabling service sectors in LAC, OECD economies, and globally, by sector 86
FIGURES 2.4. LAC's commitments in digital trade-enabling services, by sector (% shares) 88
FIGURE 2.5. Average mode 1 STRIs in digitally deliverable services (LAC, OECD economies, and global average) 91
FIGURE 2.6. Level of GATS mode 1 commitments in select digitally deliverable services (% shares of total commitments) 92
FIGURE 2.7. Digital trade regulation readiness: country scores by LAC subregion 95
FIGURE 2.8. Types of e-signatures in LAC 97
FIGURE 2.9. Intermediary liability requirements in LAC countries 101
FIGURE 2.10. Percentage of population using the internet in LAC countries, 2024 (% share) 104
FIGURE 2.11. Fixed broadband household penetration and distribution of technologies in LAC countries, 2024 (% shares) 106
FIGURE 2.12. Adults in LAC with a transaction account, 2011-2024 110
FIGURE 2.13. LAC countries' logistics performance scores 113
FIGURE 2.14. LAC countries' current rate of implementation commitments of the WTO, TFA 115
FIGURE 2.15. UN trade facilitation scores in LAC countries and developed economies, 2023 (composite score, maximum = 500%) 116
FIGURE 2.16. Managerial capabilities and income levels in LAC and globally, 2004-2022 119
FIGURE 2.17. Comparison of self-reported and externally evaluated management practices in LAC and global firms 120
FIGURE 2.18. Number of digital businesses relative to GDP per capita in LAC, 2022-2024 121
FIGURES 2.19. Funded businesses in applied tech and deep tech in LAC and UMICs, 1971-2022 123
FIGURE 2.20. Share of STEM graduates among tertiary graduates, LAC and global regions 125
FIGURE 2.21. Equity investment in digital firms, LAC, 2022-2024 127
FIGURE 3.1. Participation of LAC countries in RTAs with provisions on digital trade 152
Boxes 11
BOX 1.1. Data sources for digital trade 40
BOX 1.2. Simulations of new technologies and digitalization in LAC 48
BOX 1.3. Artificial intelligence and digital trade 51
BOX 1.4. The rise of creative industries in LAC 53
BOX 1.5. Costa Rica's digitally delivered services export boom 55
BOX 1.6. Growth of cross-border digital sales in the Southern Cone 63
BOX 1.7. The importance of intraregional market for Pacific Alliance digital services exporters 69
BOX 2.1. Enabling factors for digitally delivered services trade 81
BOX 2.2. The impact of digital infrastructure and regulation on trade costs in Latin America and the Caribbean 108
BOX 2.3. Strengthening subregional cross-border payment infrastructure in Central America 111
FIGURE A. Projected annual growth rate in digitally deliverable services exports, 2023-2040 49
FIGURE B. Projected annual growth rate of exports from Latin American regions between 2023 and 2040 50
FIGURE C. Export activity by online presence and firm size (% of firms that export) 63
FIGURE D. Estimated average impact of select determinants on services and digitally delivered services exports (% shares) 82
FIGURE E. Estimated average reduction in trade costs in LAC 108
*표시는 필수 입력사항입니다.
| 전화번호 |
|---|
| 기사명 | 저자명 | 페이지 | 원문 | 기사목차 |
|---|
| 번호 | 발행일자 | 권호명 | 제본정보 | 자료실 | 원문 | 신청 페이지 |
|---|
도서위치안내: / 서가번호:

우편복사 목록담기를 완료하였습니다.
*표시는 필수 입력사항입니다.
저장 되었습니다.
