
 대표어
대표어
 https://www.usitc.gov/sites/default/files/publications/332/working_papers/wp_posting_ai_paper_ferrantino_yuan_09102026_final.pdf
권호기사보기
| 기사명 | 저자명 | 페이지 | 원문 | 기사목차 |
|---|
결과 내 검색
동의어 포함
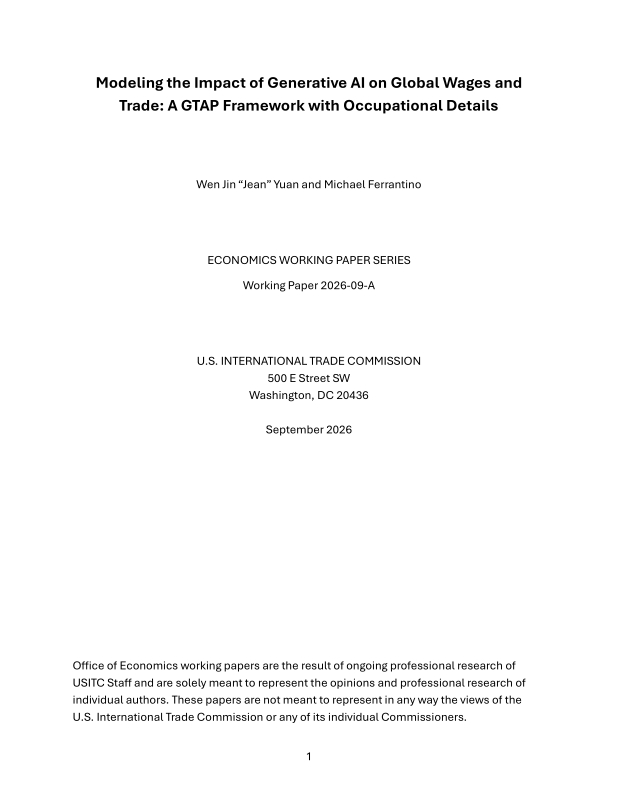
Title page 1
Contents 1
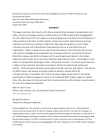
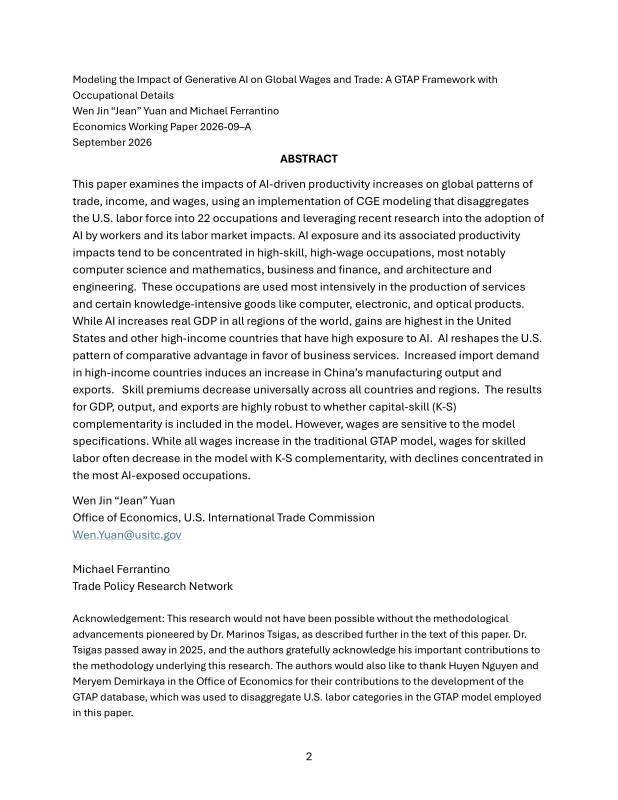
Abstract 2
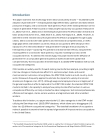
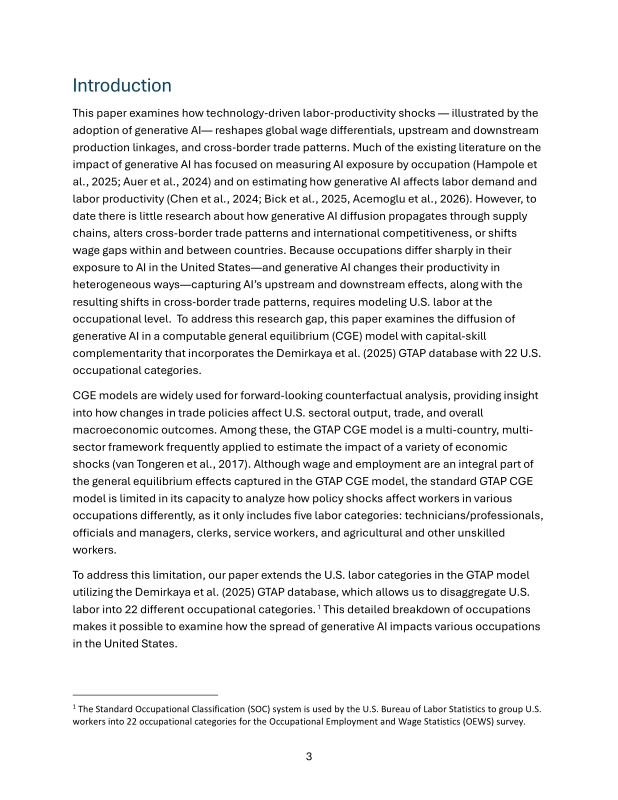
Introduction 3
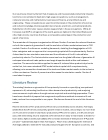
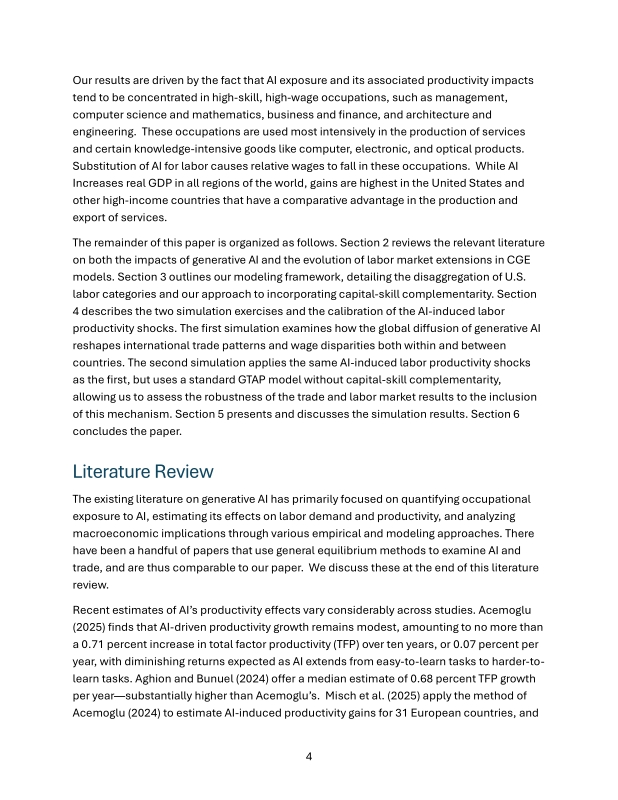
Literature Review 4
Structure of the Modified GTAP Model with 22 Different Occupations and Capital-Skill Complementarity 9
Calibration of AI-Induced Labor Productivity Shocks Implemented in Two Global Simulations 13
Discussion of Simulation Results 19
Concluding Remarks 30
Bibliography 32
Appendices 36
Figure 1. Input substitution possibilities for producing sectors in the standard GTAP model 10
Figure 2. Input substitution possibilities for producing sectors in our enhanced version of the GTAP model for the United States 12
Figure 3a (left) and 3b (right). Input substitution possibilities for producing sectors in our enhanced version of the GTAP model VS. the standard... 19
Figure 4. Change in Real Wages Across Regions, in percent, relative to the baseline, simulation 1 22
Figure 5. Change in U.S. Real Wages, in percent, relative to the baseline, simulation 1 23
Figure 6. Change in Real Wages Across Regions, in percent, relative to the baseline, simulation 2 run with the standard GTAP model 23
Figure 7. Change in U.S. Real Wages, in percent, relative to the baseline, simulation 2 run with the standard GTAP model 24
Figure 8. Sectors with the Highest Chinese Exports, in billion dollars, Relative to the baseline, simulation 1 30
*표시는 필수 입력사항입니다.
| 전화번호 |
|---|
| 기사명 | 저자명 | 페이지 | 원문 | 기사목차 |
|---|
| 번호 | 발행일자 | 권호명 | 제본정보 | 자료실 | 원문 | 신청 페이지 |
|---|
도서위치안내: / 서가번호:

우편복사 목록담기를 완료하였습니다.
*표시는 필수 입력사항입니다.
저장 되었습니다.
