
 대표어
 https://www.wri.org/research/land-rights-and-forest-outcomes-afrodescendant-communities-brazil-colombia-and-suriname
권호기사보기
| 기사명 | 저자명 | 페이지 | 원문 | 기사목차 |
|---|
결과 내 검색
동의어 포함
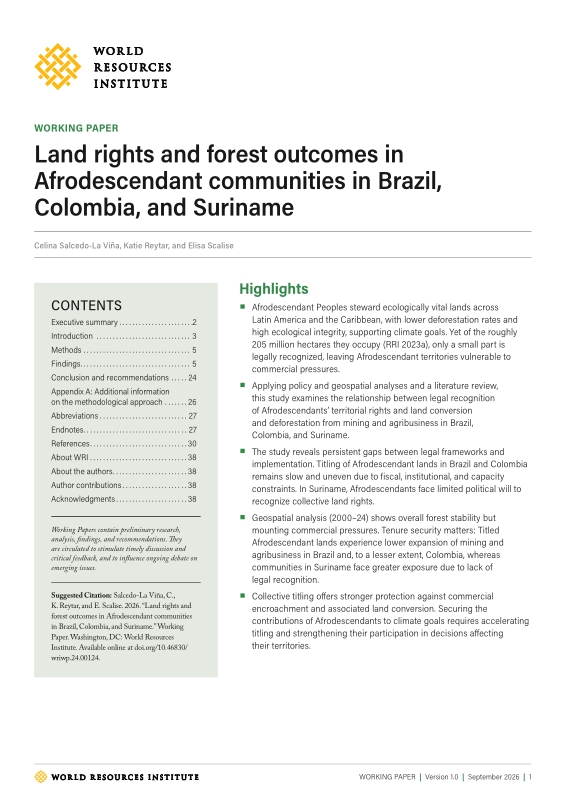
Title page 1
Contents 1
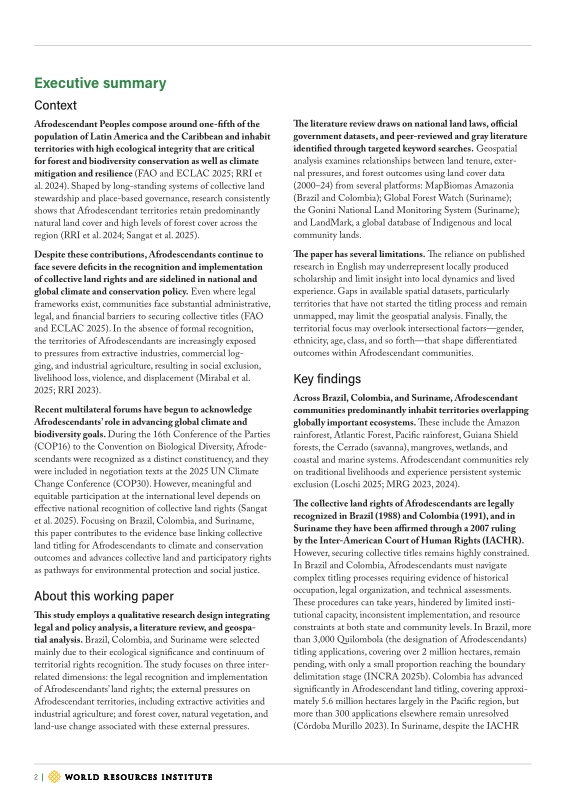
Executive summary 2
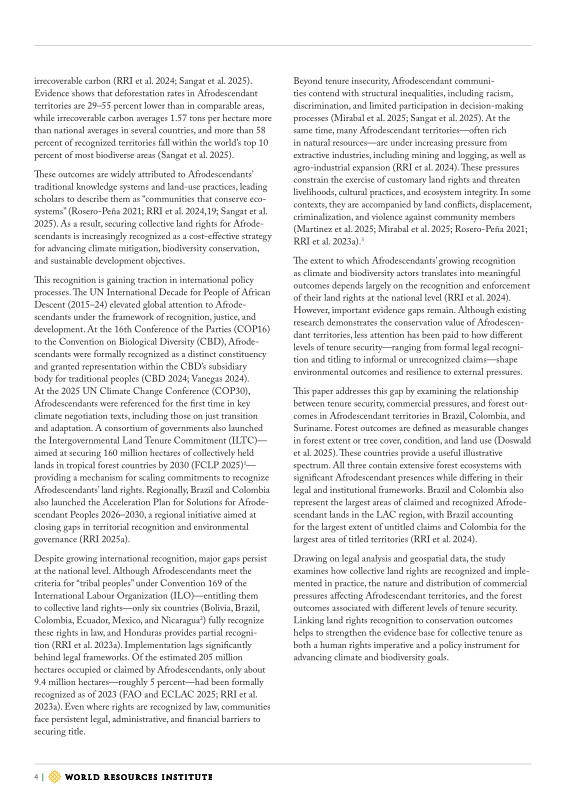
Introduction 3
Methods 5
Findings 5
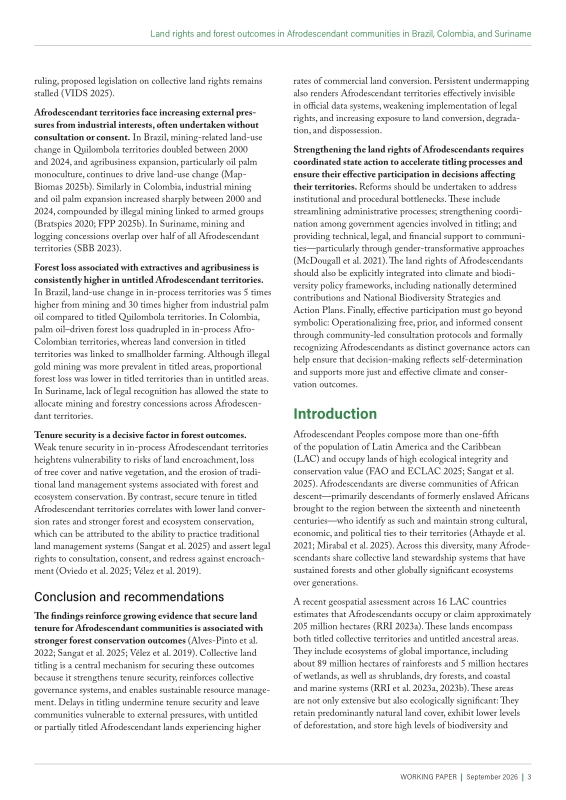
Conclusion and recommendations 24
Appendix A: Additional information on the methodological approach 26
Abbreviations 27
Endnotes 27
References 30
Acknowledgments 38
About WRI 38
About the authors 38
Author contributions 38
Figure 1. Stages of Quilombola titling process 6
Figure 2. Number of Quilombola territories per step of the titling process 6
Figure 3. Distribution of mapped Quilombola territories by titling status, per biome 7
Figure 4. Proportion of land cover within mapped Quilombola territories in 2000 and 2024, by type 8
Figure 5. Comparison of changes in land cover within Quilombola territories (2000-2024), by titling status 9
Figure 6. Comparison of changes in the type of nonvegetated land cover between 2000 and 2024, by titling status 10
Figure 7. Comparison of changes in mining area within Quilombola territories per state (2000-2024), by titling status 10
Figure 8. Example of mining impacts in a Quilombola territory in Oriximiná, Pará 11
Figure 9. Comparison of changes in the type of farming area within Quilombola territories, by titling status 12
Figure 10. Satellite image of oil palm plantation encroachment into an in-process Quilombola territory in Pará 13
Figure 11. Key stages of Afro-Colombian land titling process 14
Figure 12. Distribution of titled and in-process Community Councils 14
Figure 13. Proportion of land cover within mapped Afro-Colombian territories in 2000 and 2024 by type 15
Figure 14. Comparison of changes in land cover within Afro-Colombian territories (2000-2024), by titling status 16
Figure 15. Comparison of changes in type of nonvegetated land cover within Afro-Colombian territories (2000-2024), by titling status 16
Figure 16. Satellite image of mining impacts within a titled Afro-Colombian territory in El Cantón del San Pablo, Chocó 17
Figure 17. Comparison of changes in the type of farming area in Afro-Colombian territories, by titling status 18
Figure 18. Satellite image of oil palm plantation encroachment into an in-process Afro-Colombian territory in Pelaya, Cesar 18
Figure 19. Map of Afrodescendant Tribal lands in Suriname 19
Figure 20. Proportion of land cover within Tribal lands in 2024, by type 20
Figure 21. Forestry and gold mining concessions and associated tree cover loss within Tribal lands 21
Figure 22. Percentage of Tribal lands overlapping with concessions and percent tree cover loss (2001-2024) 22
Figure 23. Satellite image of mining impacts in Saamaka territory 22
*표시는 필수 입력사항입니다.
| 전화번호 |
|---|
| 기사명 | 저자명 | 페이지 | 원문 | 기사목차 |
|---|
| 번호 | 발행일자 | 권호명 | 제본정보 | 자료실 | 원문 | 신청 페이지 |
|---|
도서위치안내: / 서가번호:

우편복사 목록담기를 완료하였습니다.
*표시는 필수 입력사항입니다.
저장 되었습니다.
