
 대표어
 https://www.iea.org/reports/gas-reserve-mechanisms-and-flexibility-options

권호기사보기
| 기사명 | 저자명 | 페이지 | 원문 | 기사목차 |
|---|
결과 내 검색
동의어 포함
Title page 1
Contents 6
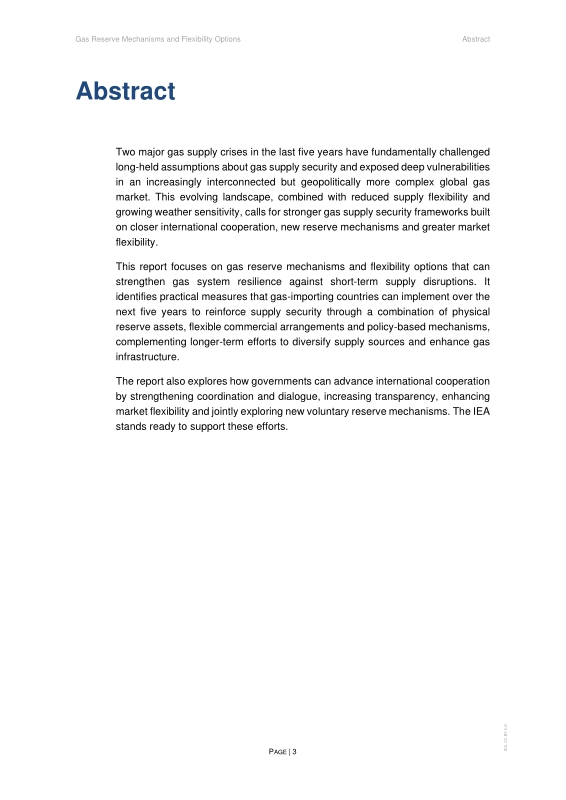
Abstract 3
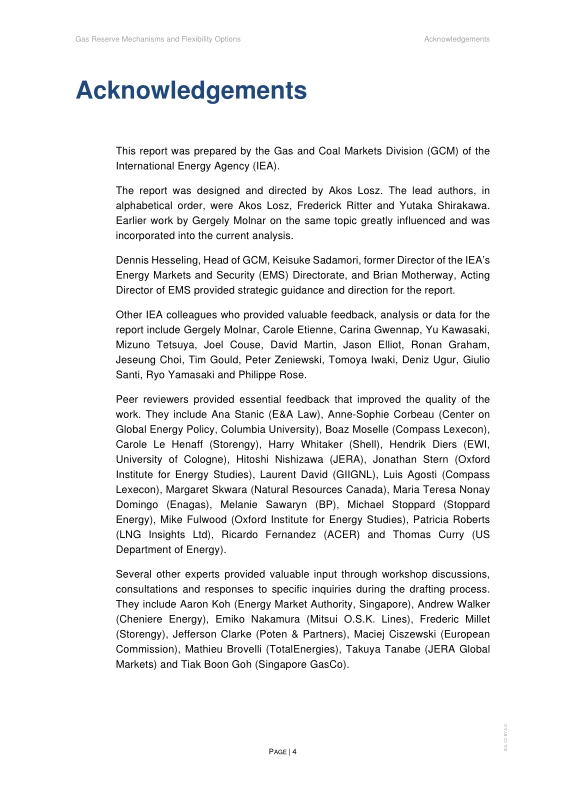
Acknowledgements 4
Executive summary 7
1. Introduction 10
2. A gas market in transition 12
2.1. Lessons from the 2022-2023 energy crisis 12
2.2. The post-crisis gas market environment 13
3. Flexibility options along gas and LNG value chains 19
4. Physical gas reserves 21
4.1. Underground gas storage 25
4.2. LNG tank storage 31
4.3. LNG FSRU and FSU facilities 36
4.4. LNG floating storage on vessels 40
5. Flexible commercial options for LNG 45
5.1. Existing LNG contracts 47
5.2. New LNG contracts 53
5.3. Commercial innovation 59
5.4. LNG swaps 67
6. Policy tools to create gas reserve mechanisms 69
6.1. Mandatory storage obligations 71
6.2. Strategic underground gas storage 74
6.3. Strategic cushion gas reserves 79
6.4. Buffer LNG schemes 82
7. Options to increase international cooperation 90
7.1. Lessons from the IEA oil emergency response framework 90
7.2. Recommendations 94
Abbreviations and acronyms 104
Figure 1.1. Overview of gas reserve mechanisms and flexibility options 11
Figure 2.1. Year-on-year change in LNG imports by region, 2022 vs. 2021 13
Figure 4.1. Physical storage capacity in operation and under construction worldwide, end of 2024 21
Figure 4.2. Distribution of UGS capacity in operation and under construction, by region, 2024 26
Figure 4.3. European UGS capacity and average maximum utilisation by country, 2024 30
Figure 4.4. Onshore LNG tank storage capacity at regasification terminals by region, end of 2024 32
Figure 4.5. Cost of physical storage 33
Figure 4.6. Top 10 countries by onshore LNG tank storage capacity, end of 2024 35
Figure 4.7. Distribution of FSRU capacity by region, end of 2024 37
Figure 4.8. Estimated monthly cost of LNG floating storage 42
Figure 4.9. LNG on water for more than 20 days 43
Figure 5.1. The evolution of key LNG contract characteristics, 2016-2030 46
Figure 5.2. Expiration of LNG contracts in effect in 2025 55
Figure 5.3. LNG liquefaction capacity and output from legacy plants, 2025 and 2030 56
Figure 5.4. Contractual position of LNG portfolio players, 2020-2030 58
Figure 5.5. Monthly LNG imports relative to the annual average in geographies with complementary seasonal demand profiles, 2020-2025 average 61
Figure 5.6. Illustrative cost of LNG call options at different strike prices and contract durations 64
Figure 6.1. Underground storage capacity and strategic gas reserves in selected EU member states 78
Boxes 22
Box 4.1. Linepack management: The hidden flexibility embedded in gas transmission systems 22
Box 5.1. Japan's 2017 JFTC survey on LNG contracts 49
*표시는 필수 입력사항입니다.
| 전화번호 |
|---|
| 기사명 | 저자명 | 페이지 | 원문 | 기사목차 |
|---|
| 번호 | 발행일자 | 권호명 | 제본정보 | 자료실 | 원문 | 신청 페이지 |
|---|
도서위치안내: / 서가번호:

우편복사 목록담기를 완료하였습니다.
*표시는 필수 입력사항입니다.
저장 되었습니다.
