
 대표어
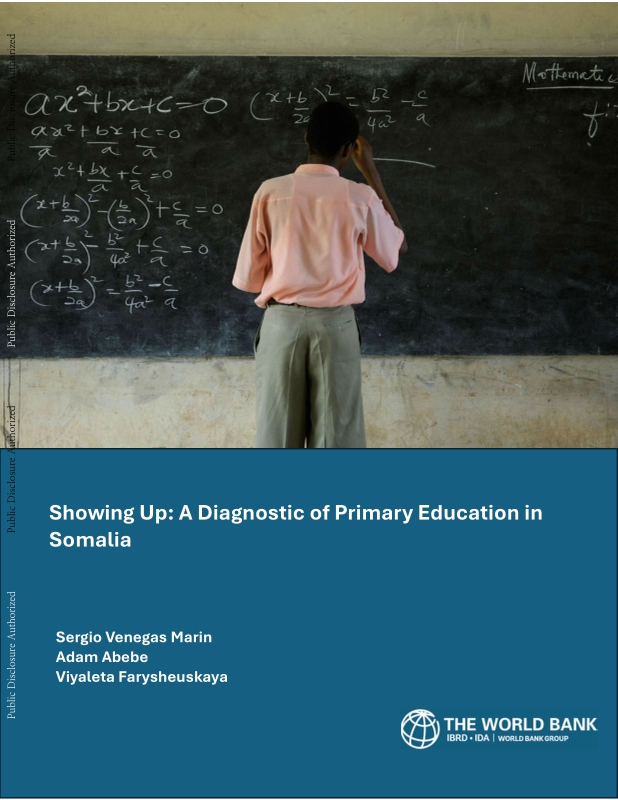
 https://documents.worldbank.org/en/publication/documents-reports/documentdetail/099092926110032561
권호기사보기
| 기사명 | 저자명 | 페이지 | 원문 | 기사목차 |
|---|
결과 내 검색
동의어 포함
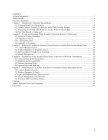
Title page 1
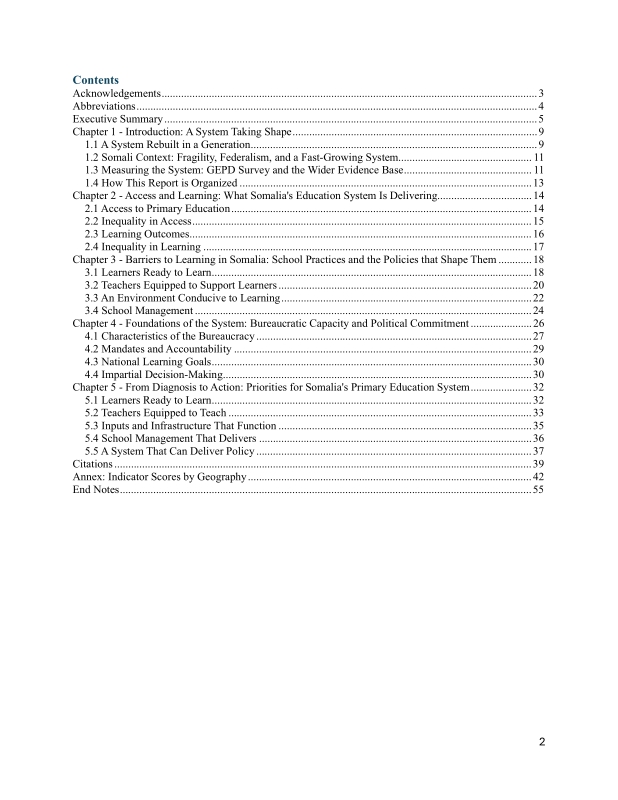
Contents 3
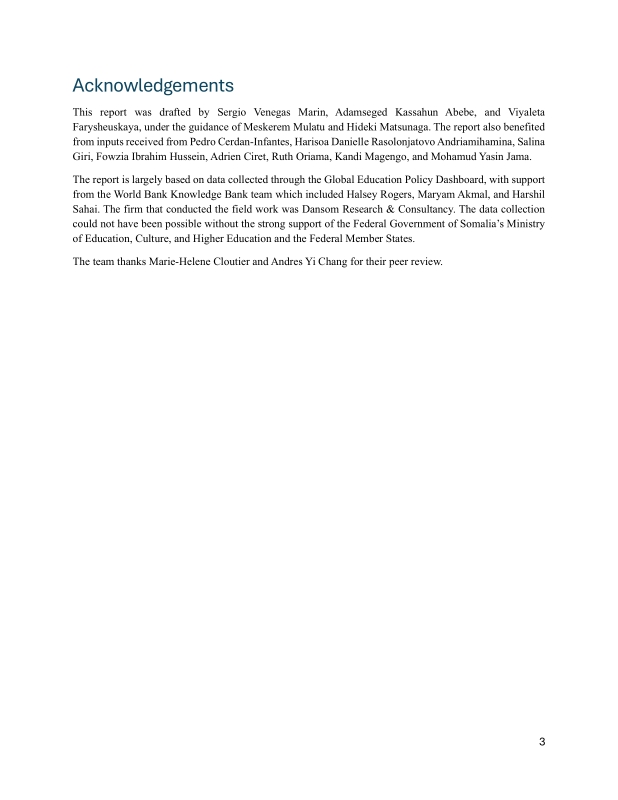
Acknowledgements 4
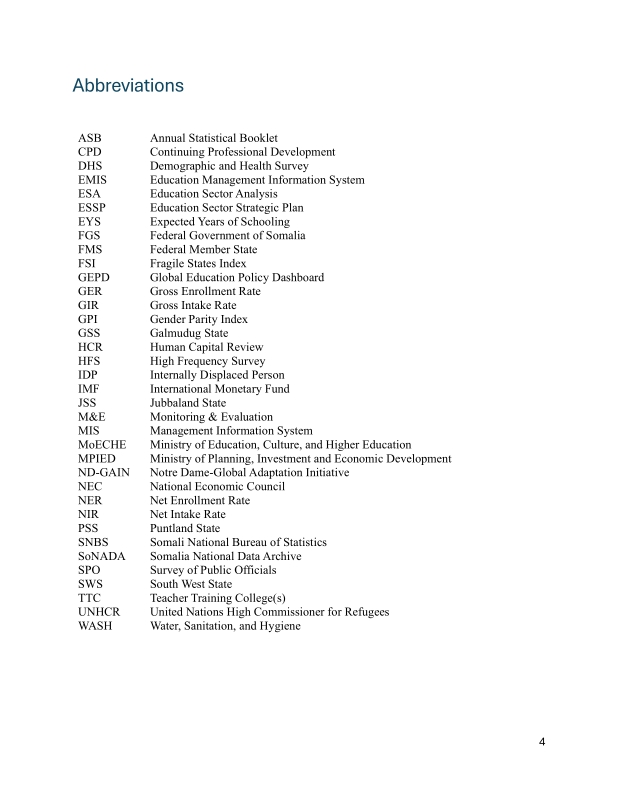
Abbreviations 5
Executive Summary 6
Chapter 1. Introduction: A System Taking Shape 10
1.1. A System Rebuilt in a Generation 10
1.2. Somali Context: Fragility, Federalism, and a Fast-Growing System 12
1.3. Measuring the System: GEPD Survey and the Wider Evidence Base 12
1.4. How This Report is Organized 14
Chapter 2. Access and Learning: What Somalia's Education System Is Delivering 15
2.1. Access to Primary Education 15
2.2. Inequality in Access 16
2.3. Learning Outcomes 17
2.4. Inequality in Learning 18
Chapter 3. Barriers to Learning in Somalia: School Practices and the Policies that Shape Them 19
3.1. Learners Ready to Learn 19
3.2. Teachers Equipped to Support Learners 21
3.3. An Environment Conducive to Learning 23
3.4. School Management 25
Chapter 4. Foundations of the System: Bureaucratic Capacity and Political Commitment 27
4.1. Characteristics of the Bureaucracy 28
4.2. Mandates and Accountability 30
4.3. National Learning Goals 31
4.4. Impartial Decision-Making 31
Chapter 5. From Diagnosis to Action: Priorities for Somalia's Primary Education System 33
5.1. Learners Ready to Learn 33
5.2. Teachers Equipped to Teach 34
5.3. Inputs and Infrastructure That Function 36
5.4. School Management That Delivers 37
5.5. A System That Can Deliver Policy 38
Citations 40
Annex: Indicator Scores by Geography 43
End Notes 56
Figure 1.1. Timeline of school establishment by Federal Member State 10
Figure 1.2. Population pyramid or growth projection, 2023-2050 11
Figure 1.3. The GEPD conceptual framework 13
Figure 1.4. Share of variation in learning outcomes explained by GEPD practices and policies 14
Figure 2.1. Primary Gross Enrollment Rate Trend, 2020-2024 15
Figure 2.2. GEPD grade 4 performance, overall and by subject 17
Figure 2.3. GEPD proficiency by gender and by urban/rural 18
Figure 3.1. Average Grade 1 Assessment Score, by Domain and Location 20
Figure 3.2. From presence to pedagogical skill, the teaching funnel, by locality 22
Figure 3.3. GEPD Teacher Policy Levers, 1-5 Scale 23
Figure 3.4. Percent of schools meeting each toilet usability criteria 24
Figure 4.1. Public Officials' Perspectives on Work Environment and Merit 29
*표시는 필수 입력사항입니다.
| 전화번호 |
|---|
| 기사명 | 저자명 | 페이지 | 원문 | 기사목차 |
|---|
| 번호 | 발행일자 | 권호명 | 제본정보 | 자료실 | 원문 | 신청 페이지 |
|---|
도서위치안내: / 서가번호:

우편복사 목록담기를 완료하였습니다.
*표시는 필수 입력사항입니다.
저장 되었습니다.
