대표어
 https://www.federalreserve.gov/econres/feds/bells-and-whistles-of-nowcasting-models-which-matter-and-when.htm
권호기사보기
| 기사명 | 저자명 | 페이지 | 원문 | 기사목차 |
|---|
결과 내 검색
동의어 포함
Title page 1
Contents 1
Abstract 2
1. Introduction 3
2. Data 5
3. Nowcasting Model 7
4. Forecasting Design 9
5. Forecast Evaluation 11
5.1. Forecast construction and loss functions 11
5.2. Balanced paired factorial contrasts 12
6. Results 13
7. Conclusion 18
Appendix 20
A. Data, model, and estimation 20
B. Additional nowcasting results 29
C. Balanced paired factorial contrasts 42
D. Moving-block bootstrap robustness 51
References 52
Figure 1. Model specification labels 10
Figure 2. Balanced paired factorial contrasts by loss function and period 14
Figure 3. Balanced paired factorial contrasts for quantile scores, by quantile level and period 17
Figure A.1. Each of the 25 series used in the nowcasting exercise, in the units in which it enters the model (Table 1), before standardization,... 21
Figure B.1. Real GDP growth forecasts and realizations by specification: pre-pandemic period. Specification labels: B excludes and T includes... 30
Figure B.2. Real GDP growth forecasts and realizations by specification: pandemic period. Specification labels: B excludes and T includes... 31
Figure B.3. Real GDP growth forecasts and realizations by specification: post-pandemic period. Specification labels: B excludes and T includes... 32
Figure B.4. RMSE by horizon and specification: pre-pandemic period. Cell entries are in percentage points of annualized quarter-on-quarter... 33
Figure B.5. RMSE by horizon and specification: pandemic period. Cell entries are in percentage points of annualized quarter-on-quarter... 34
Figure B.6. RMSE by horizon and specification: post-pandemic period. Cell entries are in percentage points of annualized quarter-on-quarter... 34
Figure B.7. CRPS by horizon and specification: pre-pandemic period. Cell entries are in percentage points of annualized quarter-on-quarter... 35
Figure B.8. CRPS by horizon and specification: pandemic period. Cell entries are in percentage points of annualized quarter-on-quarter... 36
Figure B.9. CRPS by horizon and specification: post-pandemic period. Cell entries are in percentage points of annualized quarter-on-quarter... 36
Figure B.10. Estimated economic activity factor and external growth benchmarks by specification. The posterior mean and 68 percent credible... 38
Figure B.11. Quarterly long-run-growth component implied by gt for T-SV-DH-O: posterior mean and 68 percent credible band from the same... 39
Figure B.12. Estimated idiosyncratic innovation standard deviation by series for T-SV-DH-O: posterior mean and 68 percent credible band... 40
Figure B.13. Change in the idiosyncratic innovation standard deviation attributable to the multiplicative outlier adjustment, by series,... 41
*표시는 필수 입력사항입니다.
| 전화번호 |
|---|
| 기사명 | 저자명 | 페이지 | 원문 | 기사목차 |
|---|
| 번호 | 발행일자 | 권호명 | 제본정보 | 자료실 | 원문 | 신청 페이지 |
|---|
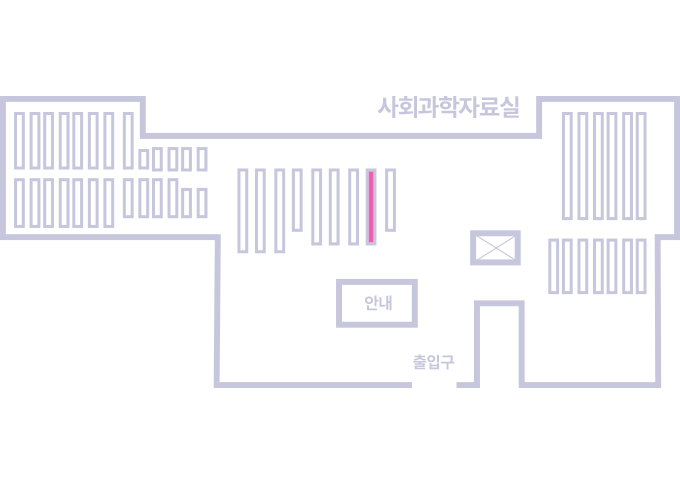
도서위치안내: / 서가번호:
우편복사 목록담기를 완료하였습니다.
*표시는 필수 입력사항입니다.
저장 되었습니다.