
 대표어
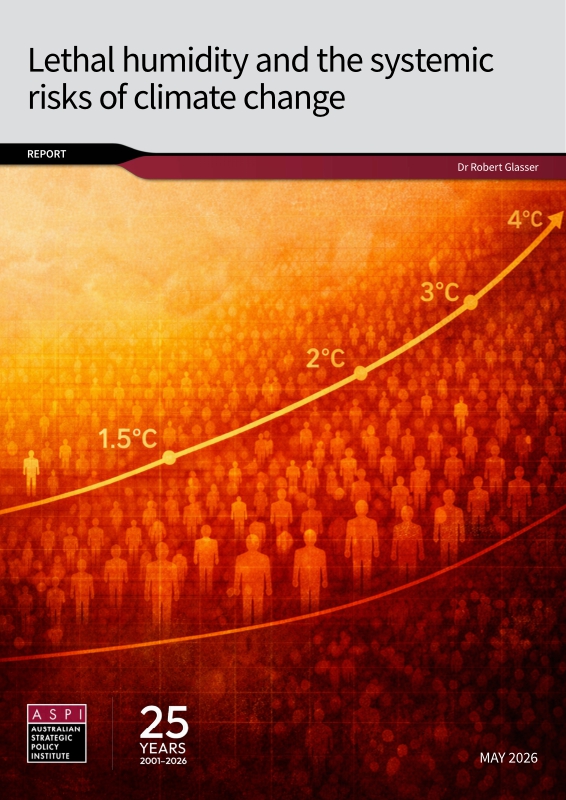
 https://www.aspi.org.au/report/lethal-humidity-and-the-systemic-risks-of-climate-change/
권호기사보기
| 기사명 | 저자명 | 페이지 | 원문 | 기사목차 |
|---|
결과 내 검색
동의어 포함
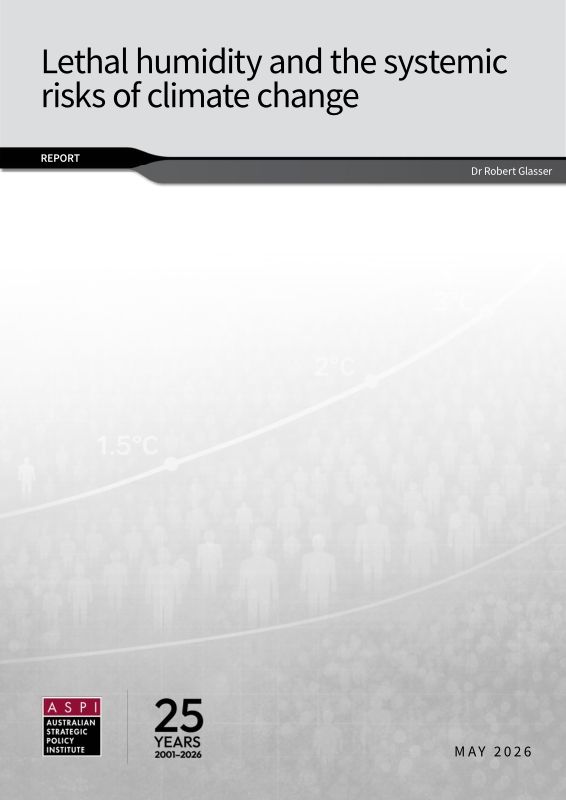
Title page 1
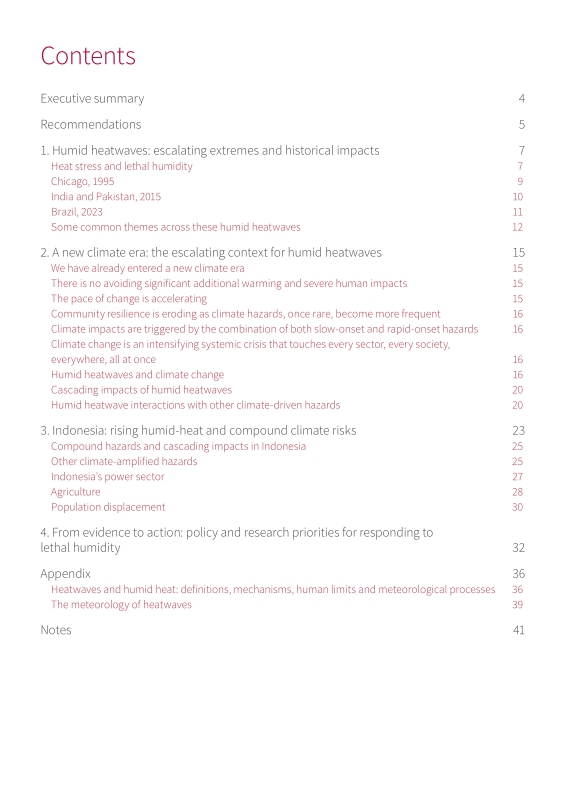
Contents 5
Acknowledgements 2
Executive summary 6
Recommendations 7
1. Humid heatwaves: escalating extremes and historical impacts 9
Heat stress and lethal humidity 9
Chicago, 1995 11
India and Pakistan, 2015 12
Brazil, 2023 13
Some common themes across these humid heatwaves 14
2. A new climate era: the escalating context for humid heatwaves 17
We have already entered a new climate era 17
There is no avoiding significant additional warming and severe human impacts 17
The pace of change is accelerating 17
Community resilience is eroding as climate hazards, once rare, become more frequent 18
Climate impacts are triggered by the combination of both slow-onset and rapid-onset hazards 18
Climate change is an intensifying systemic crisis that touches every sector, every society, everywhere, all at once 18
Humid heatwaves and climate change 18
Cascading impacts of humid heatwaves 22
Humid heatwave interactions with other climate-driven hazards 22
3. Indonesia: rising humid-heat and compound climate risks 25
Compound hazards and cascading impacts in Indonesia 27
Other climate-amplified hazards 27
Indonesia's power sector 29
Agriculture 30
Population displacement 32
4. From evidence to action: policy and research priorities for responding to lethal humidity 34
Appendix: Heatwaves and humid heat: definitions, mechanisms, human limits and meteorological processes 38
Notes 43
Figure 1. Observed global extreme humid heat 10
Figure 2. Seasonal characteristics of heat extremes for the recent historical period (1995 to 2014) 15
Figure 3. Spatial patterns of changes for frequency of dry-heat (a, c) and humid-heat (b, d) extremes in the mid-term future period (2041-2060)... 19
Figure 4. Projected impacts 20
Figure 5. Annual hot-hours under (A) 1.5, (B) 2, (C) 3, and (D) 4 °C of warming relative to preindustrial level, (E) population projection in 2050... 20
Figure 6. Present and future urban population exposure to high humid-heat stress 21
Figure 7. Projected changes in the characteristics of concurrent heatwaves and extreme sea levels 23
Figure 8. Exposure to change in number of heatwave days per year relative to the reference period 25
Figure 9. Annual increase in humid-hot days (WBGT 〉30°C), 1983 to 2016 26
Figure 10. Mean humid-heat frequency anomalies during El Niño events 26
Figure 11. Average relative sea-level rise rate for 23 coastal regions 28
Figure 12. Ecosystem services: Relation to environmental change and impacts on mobility 32
Figure 13. New Tw survivability limits for younger and older adults under shaded/indoor or sun-exposed conditions 40
Figure 14. Humid heatwaves over land in the global tropics and subtropics, and the seasonality of rainfall and humid heatwaves 42
*표시는 필수 입력사항입니다.
| 전화번호 |
|---|
| 기사명 | 저자명 | 페이지 | 원문 | 기사목차 |
|---|
| 번호 | 발행일자 | 권호명 | 제본정보 | 자료실 | 원문 | 신청 페이지 |
|---|
도서위치안내: / 서가번호:

우편복사 목록담기를 완료하였습니다.
*표시는 필수 입력사항입니다.
저장 되었습니다.
