대표어
 https://www.iea.org/reports/global-energy-and-climate-model



권호기사보기
| 기사명 | 저자명 | 페이지 | 원문 | 기사목차 |
|---|
결과 내 검색
동의어 포함
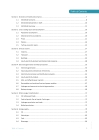
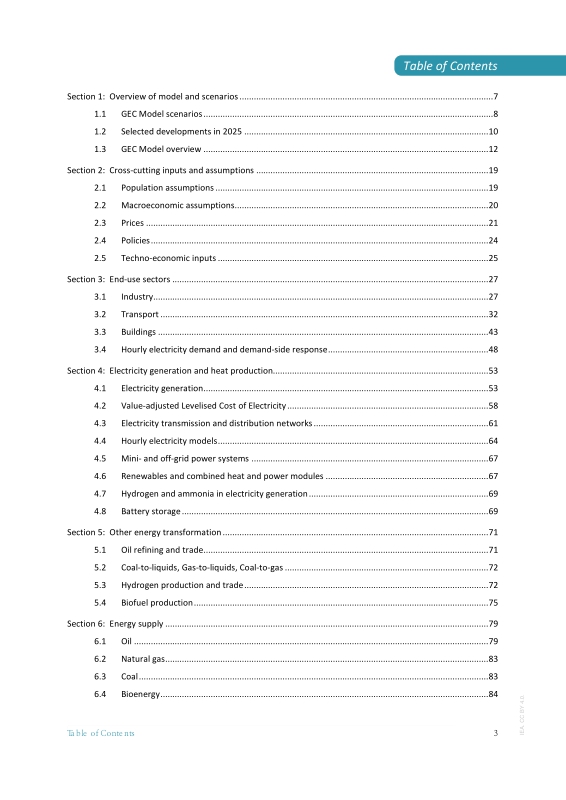
Title page 1
Contents 3
Section 1. Overview of model and scenarios 7
1.1. GEC Model scenarios 8
1.1.1. Current Policies Scenario 8
1.1.2. Stated Policies Scenario 9
1.1.3. Accelerating Clean Cooking and Electricity Services Scenario (ACCESS) 9
1.1.4. Net Zero Emissions by 2050 Scenario 9
1.1.5. Announced Pledges Scenario 9
1.2. Selected developments in 2025 10
1.3. GEC Model overview 12
1.3.1. Modelling methodology 12
1.3.2. Data inputs 14
1.3.3. Regional coverage and time horizon 15
1.3.4. Capabilities and features 15
1.3.5. Connections with the international energy modelling community 16
Section 2. Cross-cutting inputs and assumptions 18
2.1. Population assumptions 18
2.2. Macroeconomic assumptions 19
2.3. Prices 20
2.3.1. International fossil fuel prices 20
2.3.2. CO₂ prices 21
2.3.3. End-user prices 22
2.4. Policies 23
2.5. Techno-economic inputs 24
Section 3. End-use sectors 26
3.1. Industry 26
3.1.1. Industry model coverage and approach 27
3.1.2. Energy-intensive sub-sectors 28
3.1.3. Non-energy-intensive sub-sectors 30
3.1.4. Industry sector investments 31
3.1.5. Input data 31
3.2. Transport 31
3.2.1. The historical database 31
3.2.2. The transport module 33
3.3. Buildings 42
3.4. Hourly electricity demand and demand-side response 47
Section 4. Electricity generation and heat production 51
4.1. Electricity generation 51
4.1.1. Capacity additions 52
4.1.2. Generation volumes 53
4.1.3. Calculation of the capacity credit and capacity factor of variable renewables 54
4.2. Value-adjusted Levelised Cost of Electricity 56
4.3. Electricity transmission and distribution networks 59
4.4. Hourly electricity models 62
4.5. Mini- and off-grid power systems 65
4.6. Renewables and combined heat and power modules 65
4.6.1. Combined heat and power and distributed generation 65
4.6.2. Renewable energy 65
4.7. Hydrogen and ammonia in electricity generation 67
4.8. Battery storage 67
Section 5. Other energy transformation 69
5.1. Oil refining and trade 69
5.2. Coal-to-liquids, Gas-to-liquids, Coal-to-gas 70
5.3. Hydrogen production and trade 70
5.4. Biofuel production 73
5.4.1. Liquid biofuel supply module 73
5.4.2. Biogas and biomethane supply module 75
Section 6. Energy supply 76
6.1. Oil 76
6.1.1. US tight oil model 79
6.2. Natural gas 80
6.3. Coal 80
6.4. Bioenergy 81
6.4.1. Bioenergy supply module 82
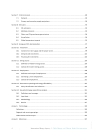
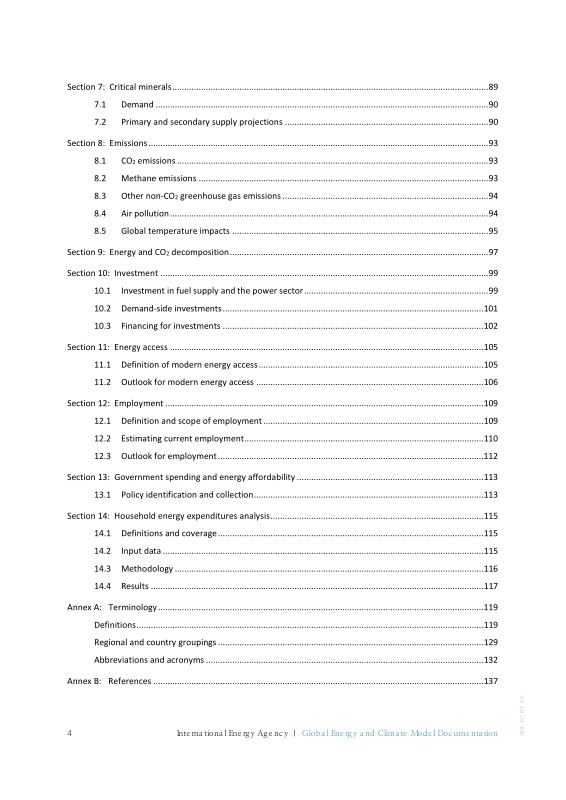
Section 7. Critical minerals 85
7.1. Demand 86
7.2. Primary and secondary supply projections 86
7.2.1. Primary supply projections 86
7.2.2. Secondary supply projections 86
Section 8. Emissions 88
8.1. CO₂ emissions 88
8.2. Methane emissions 88
8.3. Other non-CO₂ greenhouse gas emissions 89
8.4. Air pollution 89
8.5. Global temperature impacts 90
Section 9. Energy and CO₂ decomposition 91
Section 10. Investment 93
10.1. Investment in fuel supply and the power sector 93
10.1.1. Short-term oil and natural gas upstream investment 93
10.1.2. Long-term investment in fuel supply 94
10.1.3. Power sector investment 94
10.2. Demand-side investments 95
10.3. Financing for investments 96
10.3.1. Sources of finance 96
10.3.2. Cost of finance 97
Section 11. Energy access 99
11.1. Definition of modern energy access 99
11.2. Outlook for modern energy access 100
11.2.1. Outlook for electricity access 100
11.2.2. Outlook for clean cooking access 101
11.2.3. The ACCESS 101
Section 12. Employment 103
12.1. Definition and scope of employment 103
12.2. Estimating current employment 104
12.3. Outlook for employment 106
Section 13. Government spending and energy affordability 107
13.1. Policy identification and collection 107
Section 14. Household energy expenditures analysis 109
14.1. Definitions and coverage 109
14.2. Input data 109
14.3. Methodology 110
14.4. Results 111
Annex A. Terminology 112
Definitions 112
Regional and country groupings 122
Abbreviations and acronyms 125
Annex B. References 130
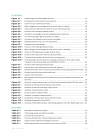
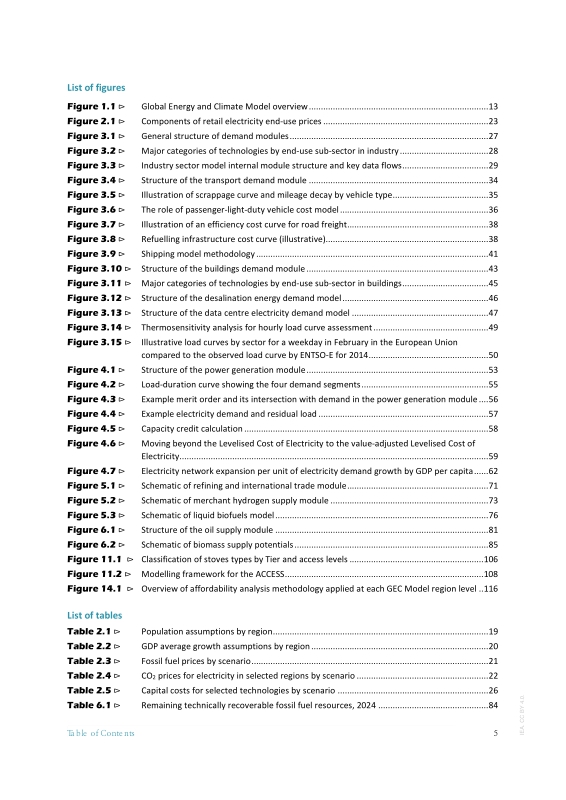
Figure 1.1. Global Energy and Climate Model overview 13
Figure 2.1. Components of retail electricity end-use prices 22
Figure 3.1. General structure of demand modules 26
Figure 3.2. Major categories of technologies by end-use sub-sector in industry 27
Figure 3.3. Industry sector model internal module structure and key data flows 28
Figure 3.4. Structure of the transport demand module 33
Figure 3.5. Illustration of scrappage curve and mileage decay by vehicle type 34
Figure 3.6. The role of the passenger-light-duty vehicle cost model 35
Figure 3.7. Illustration of an efficiency cost curve for road freight 37
Figure 3.8. Refuelling infrastructure cost curve 37
Figure 3.9. Shipping model methodology 40
Figure 3.10. Structure of the buildings demand module 42
Figure 3.11. Major categories of technologies by end-use sub-sector in buildings 44
Figure 3.12. Structure of the desalination energy demand model 45
Figure 3.13. Structure of the data centre electricity demand model 46
Figure 3.14. Thermosensitivity analysis for hourly load curve assessment 48
Figure 3.15. Illustrative load curves by sector for a weekday in February in the European Union compared to the observed load curve... 49
Figure 4.1. Structure of the power generation module 51
Figure 4.2. Load-duration curve showing the four demand segments 53
Figure 4.3. Example merit order and its intersection with demand in the power generation module 54
Figure 4.4. Example electricity demand and residual load 55
Figure 4.5. Capacity credit calculation 56
Figure 4.6. Moving beyond the Levelised Cost of Electricity to the value-adjusted Levelised Cost of Electricity 57
Figure 4.7. Electricity network expansion per unit of electricity demand growth by GDP per capita 60
Figure 5.1. Schematic of refining and international trade module 69
Figure 5.2. Schematic of merchant hydrogen supply module 71
Figure 5.3. Schematic of liquid biofuels model 74
Figure 6.1. Structure of the oil supply module 78
Figure 6.2. Schematic of biomass supply potentials 82
Figure 11.1. Classification of stoves types by Tier and access levels 100
Figure 11.2. Modelling framework for the ACCESS 102
Figure 14.1. Overview of affordability analysis methodology applied at each GEC Model region level 110
Boxes 6
Box 4.1. Long-term potential of renewables 66
Box 6.1. Methodological differences between the GEC Model and the IEA Medium-Term Oil Market Report 77
Box 6.2. Methodology to account for production decline in oil and gas fields 79
Figure C.1. Main country groupings 122
*표시는 필수 입력사항입니다.
| 전화번호 |
|---|
| 기사명 | 저자명 | 페이지 | 원문 | 기사목차 |
|---|
| 번호 | 발행일자 | 권호명 | 제본정보 | 자료실 | 원문 | 신청 페이지 |
|---|
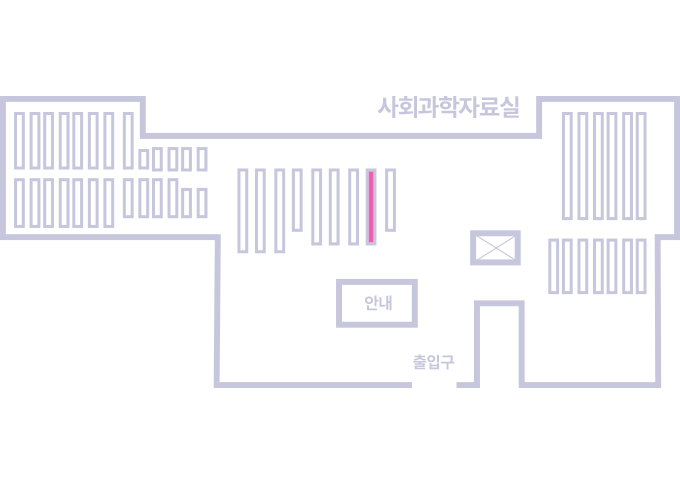
도서위치안내: / 서가번호:
우편복사 목록담기를 완료하였습니다.
*표시는 필수 입력사항입니다.
저장 되었습니다.