대표어
 https://www.ceew.in/publications/e-bus-route-service-planning-marg-tool
권호기사보기
| 기사명 | 저자명 | 페이지 | 원문 | 기사목차 |
|---|
결과 내 검색
동의어 포함
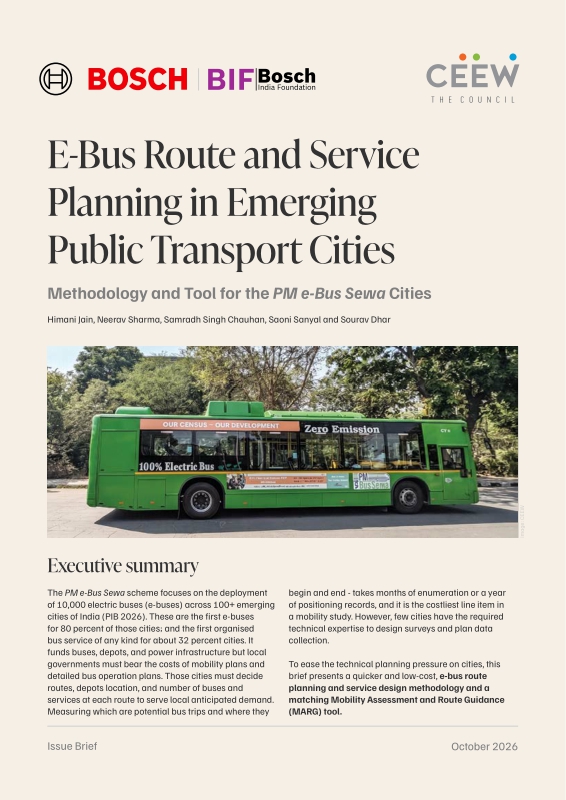
Title page 1
Contents 1
Executive summary 1
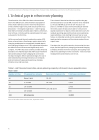
1. Technical gaps in robust route planning 4
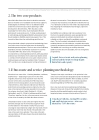
2. The two core products 5
3. E-bus route and service planning methodology 5
4. Mobility Assessment and Route Guidance (MARG) tool 9
5. Recommendations 17
References 19
Figure 1. Bus service operational planning: Linking mobility baseline, primary surveys and mode-shift modelling to a city-level operational plan 6
Figure 2. The five-stage MARG methodology 10
Figure 3. Spatial indicator families assessed in the MARG modelling framework 11
Figure 4. Convergence of evidence for corridor identification 12
Figure 5. Components of MARG: Digital twin, mobility, and spatial data assessment, and scenario simulation engine 16
*표시는 필수 입력사항입니다.
| 전화번호 |
|---|
| 기사명 | 저자명 | 페이지 | 원문 | 기사목차 |
|---|
| 번호 | 발행일자 | 권호명 | 제본정보 | 자료실 | 원문 | 신청 페이지 |
|---|
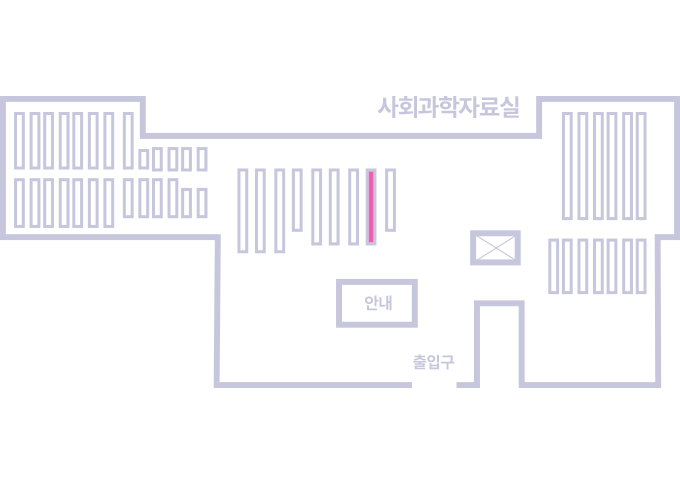
도서위치안내: / 서가번호:
우편복사 목록담기를 완료하였습니다.
*표시는 필수 입력사항입니다.
저장 되었습니다.