대표어
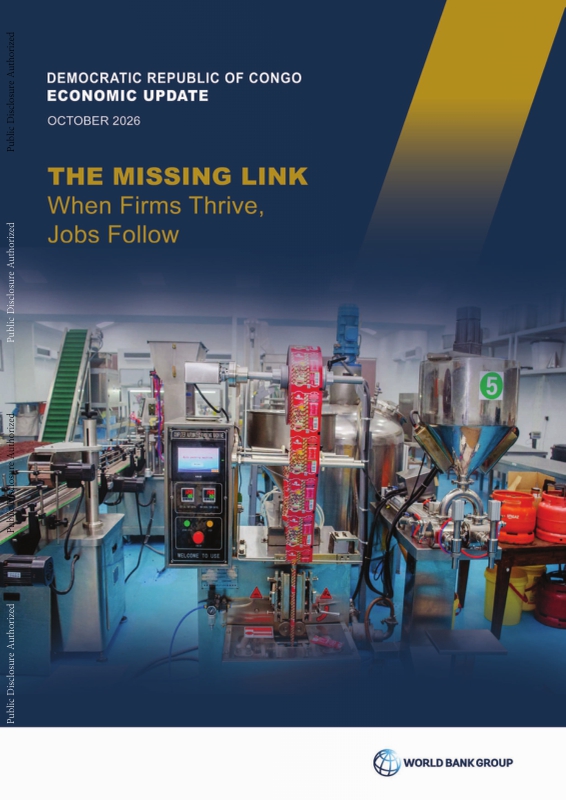
 https://documents.worldbank.org/en/publication/documents-reports/documentdetail/099102826135511180

권호기사보기
| 기사명 | 저자명 | 페이지 | 원문 | 기사목차 |
|---|
결과 내 검색
동의어 포함
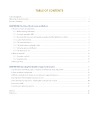
Title page 1
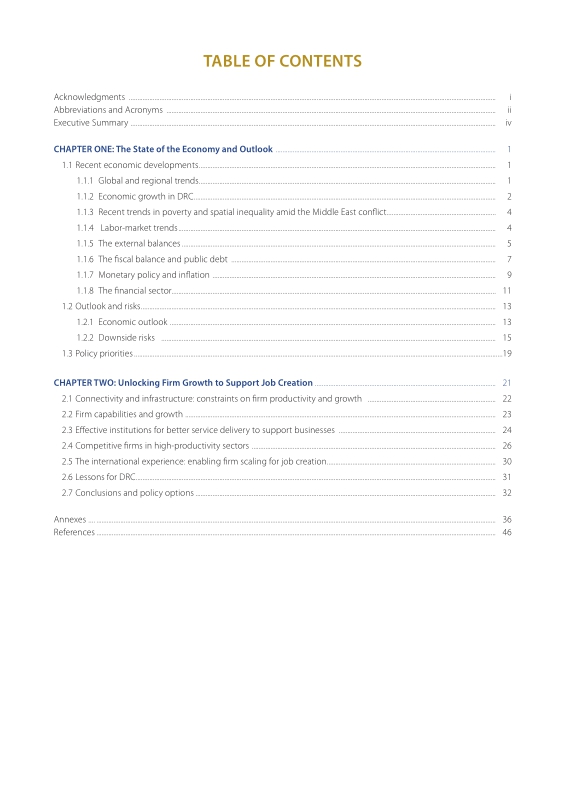
Contents 4
ACKNOWLEDGMENTS 7
ABBREVIATIONS AND ACRONYMS 8
EXECUTIVE SUMMARY 9
CHAPTER ONE. THE STATE OF THE ECONOMY AND OUTLOOK 12
1.1. Recent economic developments 13
1.1.1. Global and regional trends 13
1.1.2. Economic growth in DRC 14
1.1.3. Recent trends in poverty and spatial inequality amid the Middle East conflict 16
1.1.4. Labor-market trends 16
1.1.5. The external balances 17
1.1.6. The fiscal balance and public debt 19
1.1.7. Monetary policy and inflation 21
1.1.8. The financial sector 23
1.2. Outlook and risks 25
1.2.1. Economic outlook 25
1.2.2. Downside risks 27
1.3. Policy priorities 31
CHAPTER TWO. UNLOCKING FIRM GROWTH TO SUPPORT JOB CREATION 32
2.1. Connectivity and infrastructure: constraints on firm productivity and growth 34
2.2. Firm capabilities and growth 35
2.3. Effective institutions for better service delivery to support businesses 36
2.4. Competitive firms in high-productivity sectors 38
2.5. The international experience: enabling firm scaling for job creation 42
2.6. Lessons for DRC 43
2.7. Conclusions and policy options 44
Annex 1. Detailed Policy Options for private sector reforms in DRC 48
Annex 2. Key macroeconomic indicators 50
Annex 3. Methodological note of fuel shock 50
Annex 4. Data and methodology for the preliminary assessment of the economic effects of Ebola 51
Annex 5. Firm-level data in DRC: Coverage, sampling, and representativity of recent surveys 52
Annex 6. Characteristics of job-creating firms 53
Annex 7. Business constraints and firm performance: Methodology 54
Annex 8. From productivity gains to employment 55
Annex 9. Macroeconomic impact of total productivity shock using the World Bank's MFMod-GJ model 57
REFERENCES 58
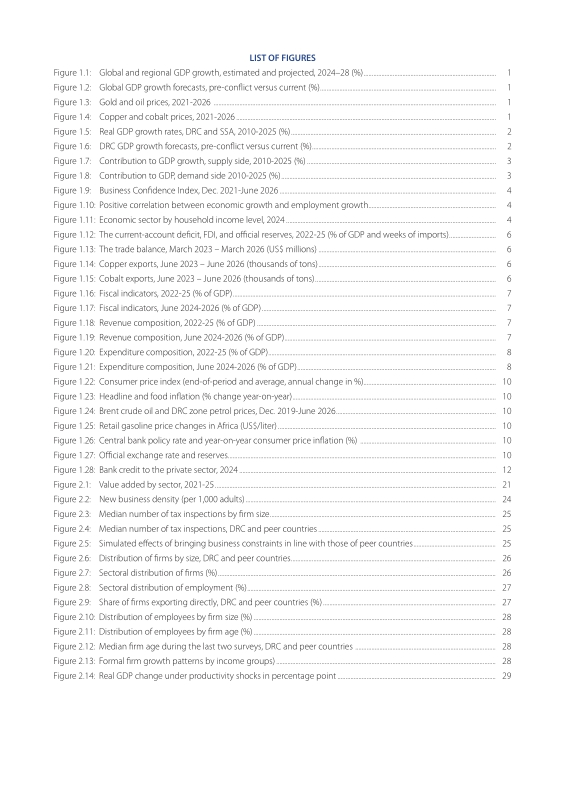
Figure 1.1. Global and regional GDP growth, estimated and projected, 2024-28 13
Figure 1.2. Global GDP growth forecasts, pre-conflict versus current 13
Figure 1.3. Gold and oil prices, 2021-2026 13
Figure 1.4. Copper and cobalt prices, 2021-2026 13
Figure 1.5. Real GDP growth rates, DRC and SSA, 2010-2025 14
Figure 1.6. DRC GDP growth forecasts, pre-conflict versus current 14
Figure 1.7. Contribution to GDP growth, supply side, 2010-2025 15
Figure 1.8. Contribution to GDP, demand side 2010-2025 15
Figure 1.9. Business Confidence Index, Dec. 2021-June 2026 16
Figure 1.10. Positive correlation between economic growth and employment growth 16
Figure 1.11. Economic sector by household income level, 2024 16
Figure 1.12. The current-account deficit, FDI, and official reserves, 2022-25 (% of GDP and weeks of imports) 18
Figure 1.13. The trade balance, March 2023-March 2026 (US$ millions) 18
Figure 1.14. Copper exports, June 2023-June 2026 (thousands of tons) 18
Figure 1.15. Cobalt exports, June 2023-June 2026 (thousands of tons) 18
Figure 1.16. Fiscal indicators, 2022-25 (% of GDP) 19
Figure 1.17. Fiscal indicators, June 2024-2026 (% of GDP) 19
Figure 1.18. Revenue composition, 2022-25 (% of GDP) 19
Figure 1.19. Revenue composition, June 2024-2026 (% of GDP) 19
Figure 1.20. Expenditure composition, 2022-25 (% of GDP) 20
Figure 1.21. Expenditure composition, June 2024-2026 (% of GDP) 20
Figure 1.22. Consumer price index (end-of-period and average, annual change in %) 22
Figure 1.23. Headline and food inflation (% change year-on-year) 22
Figure 1.24. Brent crude oil and DRC zone petrol prices, Dec. 2019-June 2026 22
Figure 1.25. Retail gasoline price changes in Africa 22
Figure 1.26. Central Bank policy rate and year-on-year consumer price inflation 22
Figure 1.27. Official exchange rate and reserves 22
Figure 1.28. Bank credit to the private sector, 2024 24
Figure 2.1. Value added by sector, 2021-25 33
Figure 2.2. New business density (per 1,000 adults) 36
Figure 2.3. Median number of tax inspections by firm size 37
Figure 2.4. Median number of tax inspections, DRC and peer countries 37
Figure 2.5. Simulated effects of bringing business constraints in line with those of peer countries 37
Figure 2.6. Distribution of firms by size, DRC and peer countries 38
Figure 2.7. Sectoral distribution of firms 38
Figure 2.8. Sectoral distribution of employment 39
Figure 2.9. Share of firms exporting directly, DRC and peer countries 39
Figure 2.10. Distribution of employees by firm size 40
Figure 2.11. Distribution of employees by firm age 40
Figure 2.12. Median firm age during the last two surveys, DRC and peer countries 40
Figure 2.13. Formal firm growth patterns by income groups 40
Figure 2.14. Real GDP change under productivity shocks in percentage point 41
Boxes 6
Box 1.1. DRC cobalt export policy: from ban to quota system 17
Box 1.2. DRC's first Eurobond issuance 20
Box 1.3. Dollarization and the policy response 23
Box 1.4. The revision of the 2026 Budget Law 26
Box 1.5. Ebola and the Economy: Emerging Evidence from DRC 29
Box 2.1. Informality 34
Box 2.2. DRC firms: from small start to scaling 41
*표시는 필수 입력사항입니다.
| 전화번호 |
|---|
| 기사명 | 저자명 | 페이지 | 원문 | 기사목차 |
|---|
| 번호 | 발행일자 | 권호명 | 제본정보 | 자료실 | 원문 | 신청 페이지 |
|---|
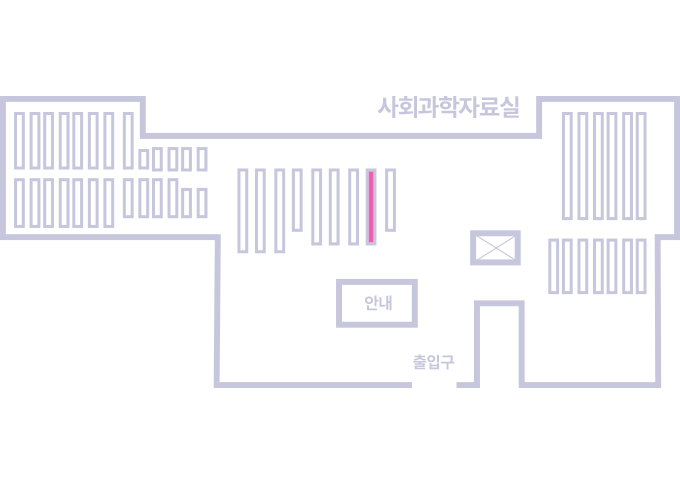
도서위치안내: / 서가번호:
우편복사 목록담기를 완료하였습니다.
*표시는 필수 입력사항입니다.
저장 되었습니다.