표·그림DB
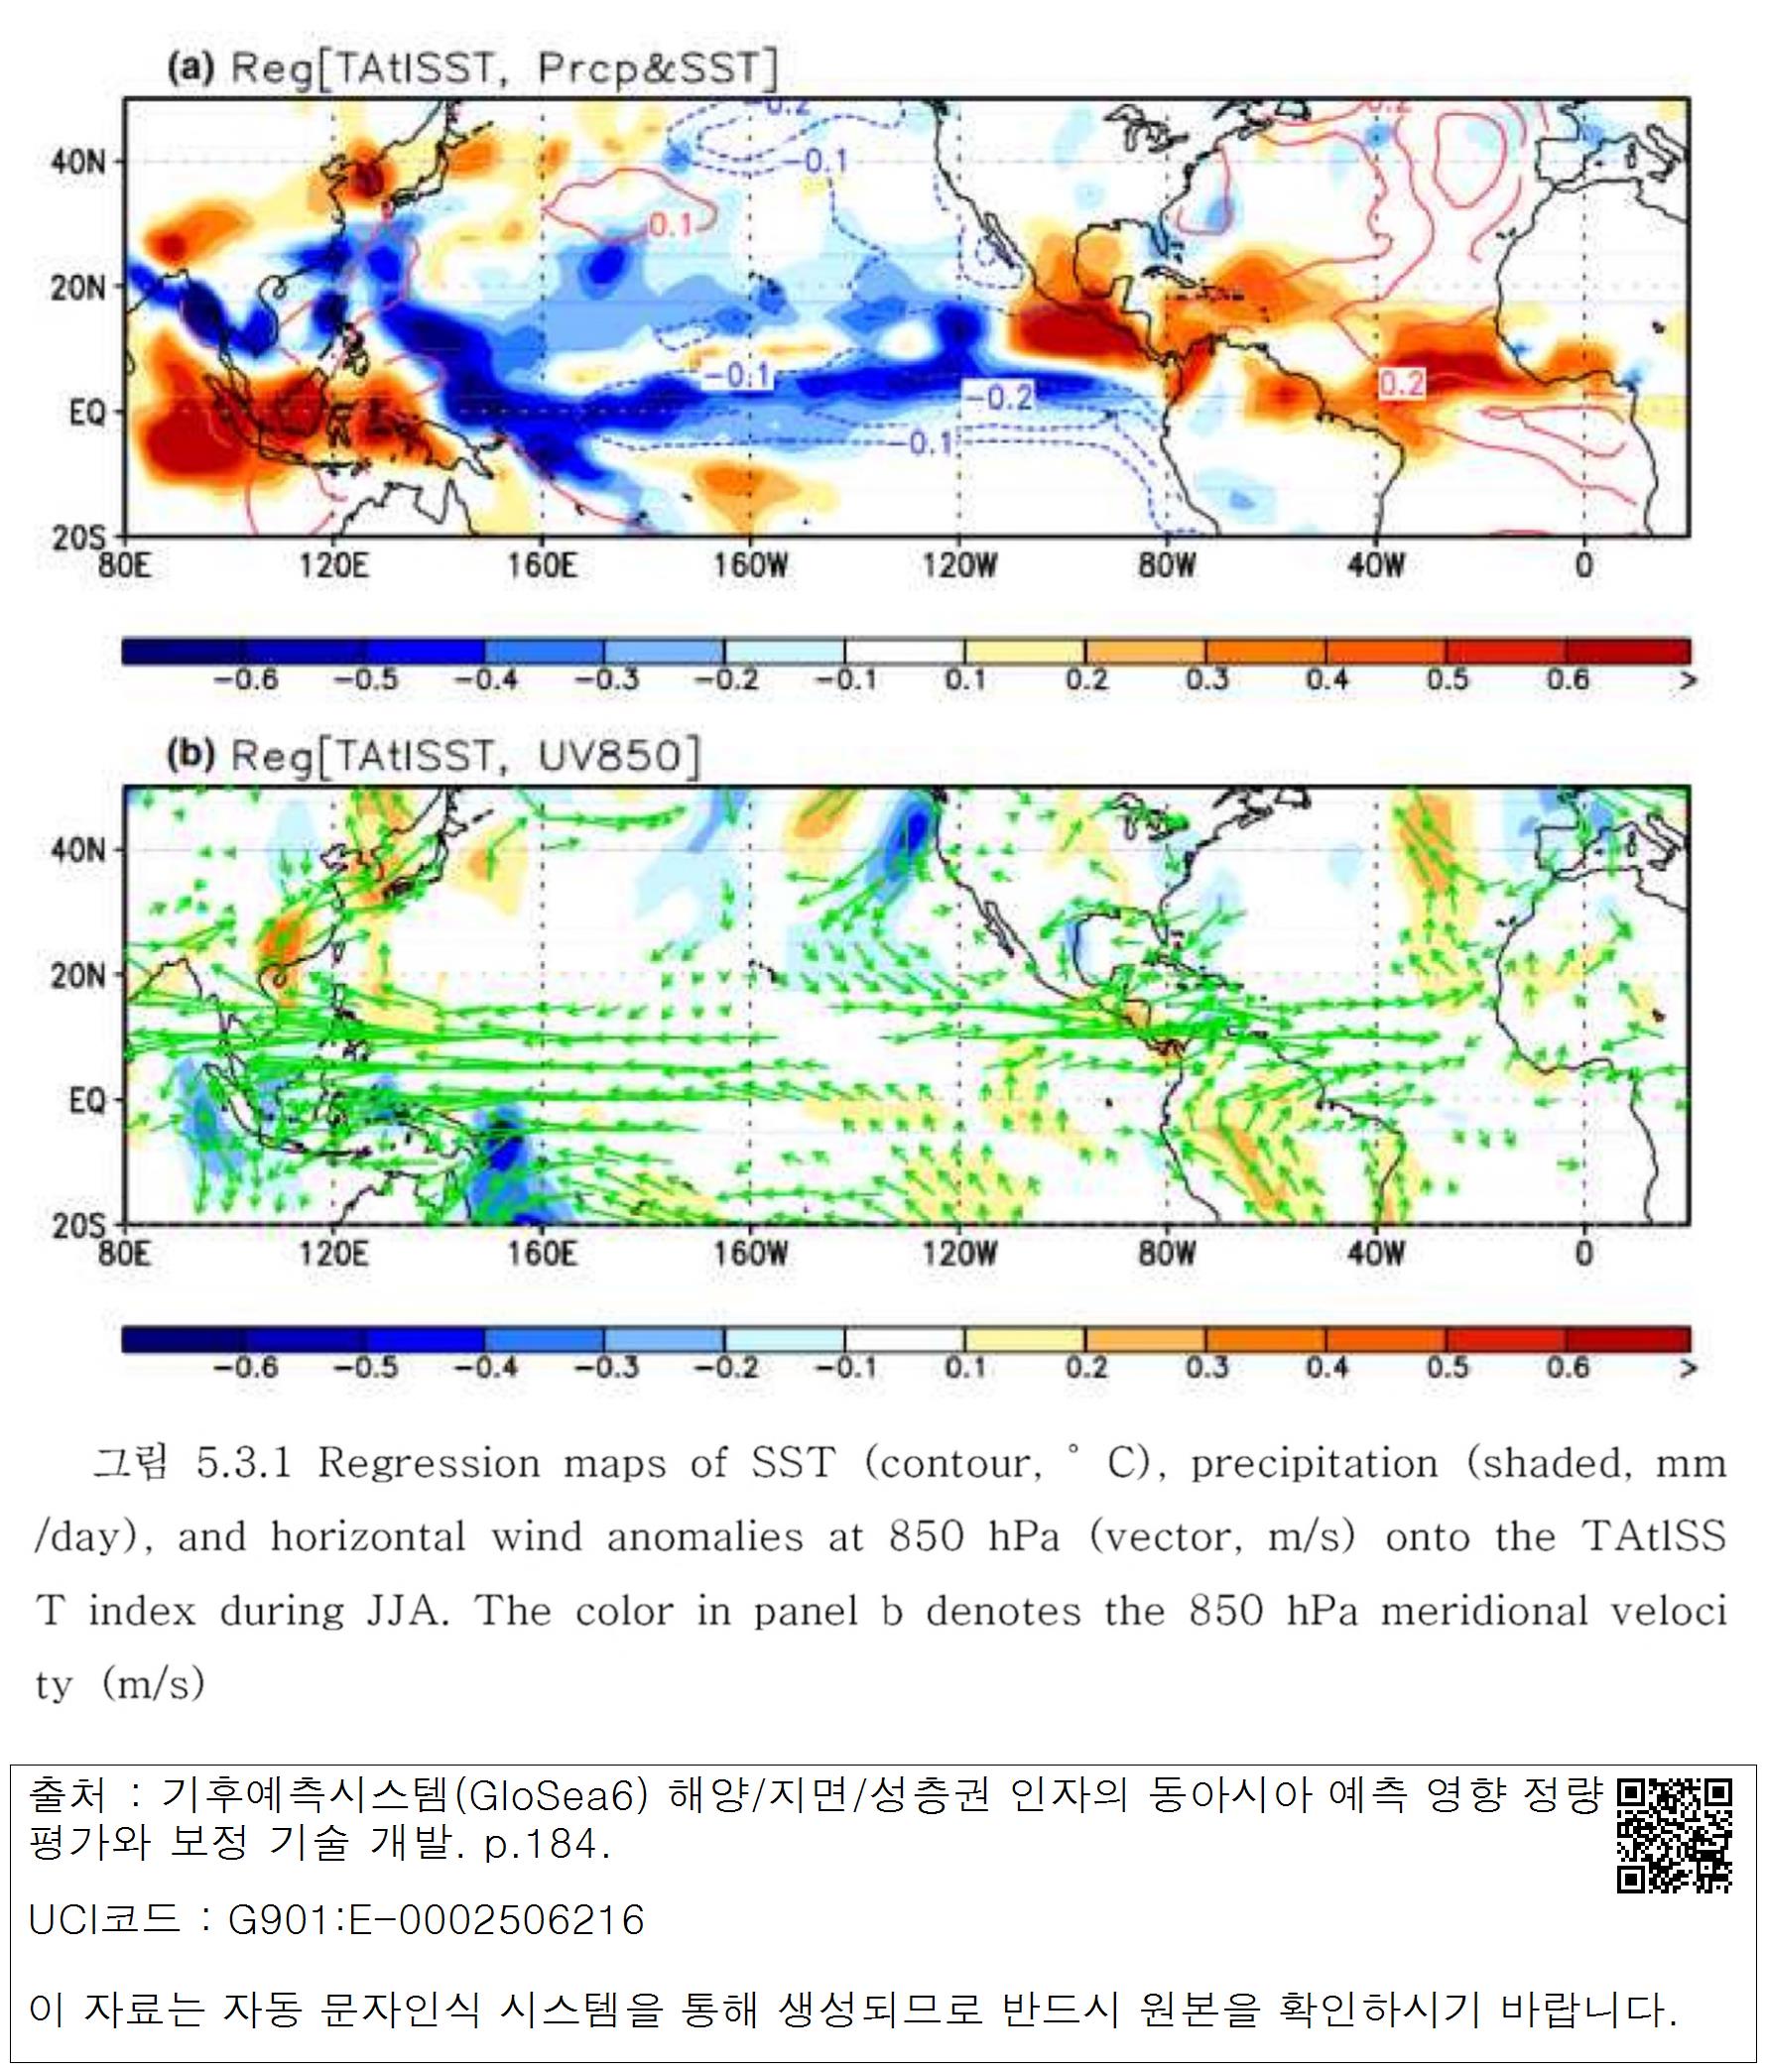
그림 5.3.1 Regression maps of SST (contour, ° C), precipitation (shaded, mm /day), and horizontal wind anomalies at 850 hPa (vector, m/s) onto the TAtlSST index during JJA. The color in panel b denotes the 850 hPa meridional velocity (m/s)
표·그림명
그림 5.3.1 Regression maps of SST (contour, ° C), precipitation (shaded, mm /day), and horizontal wind anomalies at 850 hPa (vector, m/s) onto the TAtlSST index during JJA. The color in panel b denotes the 850 hPa meridional velocity (m/s)

 대표어