
 대표어
대표어
권호기사보기
| 기사명 | 저자명 | 페이지 | 원문 | 기사목차 |
|---|
결과 내 검색
동의어 포함
표제지
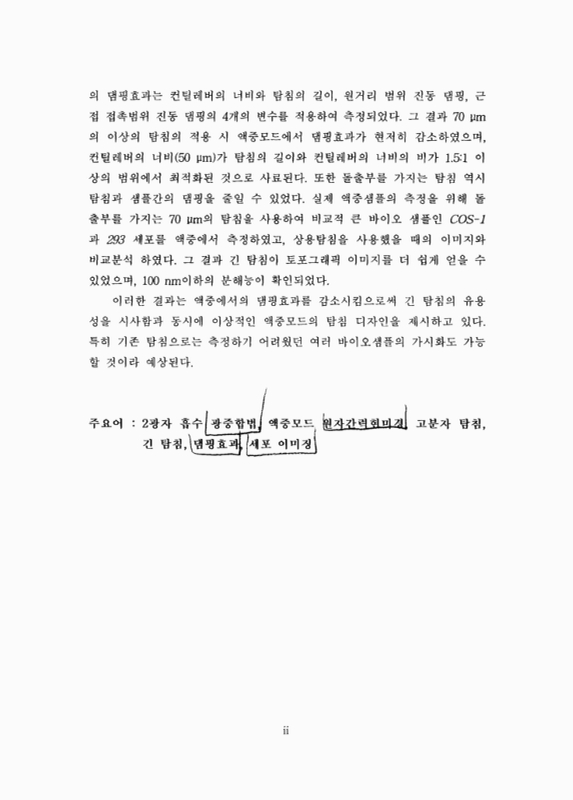
국문초록
목차
Nomenclature 10
I. 서론 11
II. 이론 13
1. 2광자 흡수 광중합을 이용한 고분자 팁의 제작 13
가. 2광자 흡수 광중합의 원리 13
나. 단일광자의 2광자 흡수의 비교 15
다. 단일광자와 2광자 사이의 원시야 회절 한계 15
라. 동적 부분 중합법을 이용한 고분자 탐침의 제작 20
2. 원자간력현미경의 기본원리와 용액중에서의 조작 24
가. 원자간력현미경의 기본 원리 24
나. 원자간력현미경의 세가지 측정 방법 27
다. 액중에서의 원자간력현미경 조작 31
III. 실험 32
1. 고분자 탐침의 제작과 탐침 크기의 확인 32
2. 원자간력현미경 액중에서의 댐핑효과 측정 35
3. 바이오샘플의 가시화 37
IV. 결과 및 고찰 40
1. 댐핑 효과의 측정 40
2. 음파모델에 의한 댐핑 효과의 해석 44
3. 상용 컨틸레버의 댐핑효과의 재해석 44
4. 바이오샘플에서의 이미지 비교 50
V. 결론 56
참고문헌 57
ABSTRACT 59
감사의 글 61
연구실적 리스트 (2004~2007) 62
Figure 1. The principle of two photon effect. 14
Figure 2. One photon-photopolymerization method by ultraviolet light source. The 3-D fabrication is difficult with the method. 16
Figure 3. Principle of two-photon adsorbed photopolymerization by a infrared light source. 17
Figure 4. Schematic illustration for maximum manufacturing resolution of one-photon adsorbed photo-polymerization. 18
Figure 5. Schematic illustration for maximum manufacturing resolution of two-photon adsorbed photo-polymerization. 19
Figure 6. Linear scanning of pattern test by TPAP (a) and a SEM image (b). 21
Figure 7. Fabrication examples of 3D shapes using TPAP. 22
Figure 8. A schematic illustration for sharp tip fabrication by the TPAP technique. 23
Figure 9. Principle of atomic force microscopy. 25
Figure 10. Schematic diagram showing the variation in pair-potential energy(Epair) with separation (r) between two atoms as described by the Lennard-Jones function.(이미지참조) 26
Figure 11. Schematic diagram of (a) contact mode (b) tapping mode. 29
Figure 12. Schematic illustration of optics for contact AFM, non-contact AFM, tapping AFM. 30
Figure 13. Schematic illustration for polymer tip fabrication instruments (a) and magnification of the polymerization part (b). 33
Figure 14. The photographies of the instrumental setup (a) and the stage for photopolymerization (b). 34
Figure 15. SEM photographs (a, b, c) of the long polymeric tips and the illustration of the base cantilever (d) exployed fot the experiment. The lengths of the tips are 35 ㎛ (a), 100 ㎛ (b), 70 ㎛ (c) and sub 10 ㎛ (d).... 36
Figure 16. The AFM instrument for sample scanning (a) and sample stage (b). 38
Figure 17. The relative vibration amplitude changes of the 4 tips. The vibration damping in the regions 'B' and 'C' is dramatically changed by the choice of the tip length. 41
Figure 18. The analysis for the cantilever width influence on the vibration damping. 43
Figure 19. A physical model depicting the influence of the cantilever width on the vibration amplitude. The vibration damping can be determined by the tangent function of the tip width and the wave energy propagation (a), (b)... 45
Figure 20. The insertion of Fig. 19(b) by the nomalization and conversion to the real experiment result. The dashed line means the result obtained by the physical model. 46
Figure 21. The vibration amplitude change of the base cantilever by the function of a tip-sample distance. 'A' and 'B' indicate the long range, the short range including the near contact range interactions, respectively. 47
Figure 22. An expanded view of the region 'C' in Fig. 17. 49
Figure 23. The observation of the COS-1 cells by the transmission optical microscopy (200x). The cell marked as a dotted rectangular area is visualized by AFM using both the long tip and the commercial tip. 51
Figure 24. AFM cell imaging using the commercial tip. Image scales are 45×45 ㎛² (a) and 5×5 ㎛² (b). The rectangluar area in (a) is expanded in (b). 52
Figure 25. AFM cell imaging using the long tip. Image scales are 45×45 ㎛² (a) and 5×5 ㎛² (b). The rectangluar area in (a) is expanded in (b). The line profiles in (c) and (d) are measured from (a) and (b) noted as "A-A" and "B-B". 53
Figure 26. A topographic image of a 293 cell in a living condition. The image scale is 45×45 ㎛². 55
*표시는 필수 입력사항입니다.
| 전화번호 |
|---|
| 기사명 | 저자명 | 페이지 | 원문 | 기사목차 |
|---|
| 번호 | 발행일자 | 권호명 | 제본정보 | 자료실 | 원문 | 신청 페이지 |
|---|
도서위치안내: / 서가번호:

우편복사 목록담기를 완료하였습니다.
*표시는 필수 입력사항입니다.
저장 되었습니다.
