
 대표어
대표어


권호기사보기
| 기사명 | 저자명 | 페이지 | 원문 | 기사목차 |
|---|
결과 내 검색
동의어 포함
표제지
국문초록
목차
제1장 서론 18
1.1. 연구배경 18
1.2. 이론적 배경 20
1.3. 연구동향 23
1.4. 연구목적 및 내용 25
제2장 1차원 수치해석 36
2.1. 1차원 수치해석의 가정 36
2.2. 1차원 수치해석의 지배방정식 36
2.2.1. 연속방정식(Continuity Equation, Overall Mass Conservation) 36
2.2.2. 화학종보존방정식(Species Conservation Equation) 37
2.2.3. 에너지보존방정식(Energy Conservation) 38
2.2.4. 상태방정식(Equation of state) 39
2.2.5. 1차원 수치해석의 화학반응 방정식 40
2.2.6. 1차원 수치해석의 가스혼합물의 평균전달특성 40
2.2.7. 1차원 수치해석의 혼합기체의 전달특성 42
2.2.8. 1차원 대향류 확산화염(OPPDIF)의 지배방정식 43
2.3. 1차원 수치해석방법 및 경계조건 45
제3장 1차원 수치해석 결과 및 고찰 52
3.1. Premixed code의 수치해석 모델 검증 52
3.2. 에탄올(Ethanol)연료의 연소특성 52
3.3. OPPDIF code의 수치해석 모델 검증 54
3.4. 재순환율(Kv)변화에 따른 에탄올 MILD연소특성 분석 55
3.5. 재순환율(Kv)에 따른 NO배출특성 분석 57
제4장 에탄올을 적용한 MILD연소특성 실험 75
4.1. 2단 연소방식을 적용한 에탄올 MILD연소시스템 75
4.2. 배기가스 분석장치 76
4.3. 온도측정 장치 77
4.4. ICCD 가시화장치 78
4.5. 실험방법 79
제5장 에탄올을 적용한 2단 연소방식 MILD연소시스템의 실험결과 및 분석 90
5.1. 에탄올의 분무특성 분석 90
5.2. 1차 예혼합 연소기의 연소특성 분석 91
5.3. 개방시스템과 밀폐시스템에서의 에탄올 연소특성비교 92
5.4. 공급유속변화에 따른 에탄올의 연소특성 분석 93
5.5. 산소농도변화에 따른 에탄올의 연소특성 분석 96
5.6. 에탄올의 열용량변화에 따른 연소특성 분석 98
5.7. 벽면온도조건변화에 따른 에탄올의 MILD연소특성 분석 99
제6장 3차원 수치해석 119
6.1. 2단 연소방식을 적용한 에탄올 MILD연소시스템의 해석방법 119
6.2. 3차원 수치해석의 지배방정식 및 화학반응 모델 120
6.2.1. 질량보존방정식 120
6.2.2. 운동량보존방정식 121
6.2.3. 에너지보존방정식 121
6.2.4. 화학종보존방정식 122
6.2.5. DPM (Discrete Phase Model) 122
6.2.6. Spray model 123
6.2.7. FGM (Flamelet Generated Manifold) method 127
제7장 3차원 수치해석결과 및 고찰 132
7.1. 실험결과와 비교를 통한 Spray 모델 검증 132
7.2. 공급유속변화에 따른 에탄올 MILD연소특성 분석 133
7.3. 산소농도변화에 따른 에탄올 MILD연소특성 분석 135
7.4. 단열조건적용에 따른 에탄올 MILD연소특성 분석 137
제8장 결론 148
8.1. 1차원 수치해석 결론 148
8.2. 에탄올 MILD연소시스템의 실험 및 3차원 수치해석결론 149
참고문헌 151
ABSTRACT 159
Figure 1.1. World energy consumption by energy source 27
Figure 1.2. Schematics of characteristics for MILD combustion technique 28
Figure 1.3. Schematic of the carbon neutral cycle 29
Figure 1.4. Schematic of MILD combustion stability limits 30
Figure 1.5. Borghi diagram for premixed turbulent combustion 30
Figure 1.6. Comparison of different combustion modes in a Tin - △T diagram 31
Figure 1.7. Schematic diagram of the combustors: two stage combustor and... 32
Figure 1.8. Reactants feeding system: (a) SN gas-fuel feed; (b) DN liquid and gas-fuel... 33
Figure 1.9. Schematic of the Delft spray flame set-up (a), photographs of the burner... 34
Figure 1.10. Schematic of ALSTOM's GT24/GT26 sequential combustion system 35
Figure 2.1. Schematic of the definition of burning velocity 48
Figure 2.2. Schematic of the measurement for adiabatic flame temperature 48
Figure 2.3. Relationship of the gas phase kinetics to the CHEMKIN 49
Figure 2.4. Relationship of the OPPDIF program to the CHEMKIN 50
Figure 2.5. Schematic of the opposed diffusion flame with hot diluted oxidant 51
Figure 2.6. Schematic of the MILD combustion burner based on internal flue gas... 51
Figure 3.1. Comparison of laminar burning velocity profiles between numerical results... 60
Figure 3.2. Comparison of burning velocity and adiabatic flame temperature 61
Figure 3.3. Comparison of mole fraction at equivalence ratio 0.6 61
Figure 3.4. Comparison of mole fraction at equivalence ratio 0.8 62
Figure 3.5. Comparison of mole fraction at equivalence ratio 1.0 62
Figure 3.6. Comparison of burning velocity at different preheating temperature 63
Figure 3.7. Comparison of adiabatic flame temperature at different preheating... 63
Figure 3.8. OPPDIF model validation of ethanol partially-premixed flame structure: (a)... 64
Figure 3.9. OPPDIF model validation of ethanol non-premixed flame structure: (a)... 65
Figure 3.10. Temperature and heat release versus mixture fraction (Z) for various... 66
Figure 3.11. Parametric variation of the oxidant inlet temperature dependence of △T... 67
Figure 3.12. Profiles of CH₄ and O₂ mole fractions and global heat release in the... 68
Figure 3.13. Mixture fraction dependence of heat release for various inlet temperatures... 69
Figure 3.14. MILD combustion region change in combustion regimes by pyrolysis... 70
Figure 3.15. Variations of NO production index (PINO) at different inlet temperature for...(이미지참조) 71
Figure 3.16. NO production index(PINO,i) of key elementary reactions for Kv=5, 9, 13,...(이미지참조) 72
Figure 3.17. Contribution ratio (CORNO,i)of key elementary reactions for Kv=5, 9, 13,...(이미지참조) 73
Figure 4.1. Concept of the two-stage MILD combustor for ethanol fuel 81
Figure 4.2. Direct photo of two-stage MILD combustion systems for experiments 82
Figure 4.3. Schematic diagram of two-stage MILD combustion experimental system 82
Figure 4.4. Direct photo of first stage premixed combustor and spark ignitor 83
Figure 4.5. Direct photo of ethanol supply system 83
Figure 4.6. Direct photo of ethanol supply system 84
Figure 4.7. Schematic diagram of spray test system 84
Figure 4.8. Direct photo of (a) quartz tube for visualization and (b) insulation furnace 85
Figure 4.9. Images of Testo 350K flue gas analyser and sampling probe 85
Figure 4.10. National Instruments temperature measurement system and K type... 86
Figure 4.11. Direct photo of 4 Quik E-DIG ICCD camera and UV SLR lens set 87
Figure 4.12. Experimental method of 2 stage ethanol MILD combustor 88
Figure 5.1. Photograph of solid cone spray for various pressure conditions 102
Figure 5.2. Pressure dependence of mass flow rate and thermal load 102
Figure 5.3. Direct images of first stage premixed flame for various oxygen... 103
Figure 5.4. Time dependence of temperature for various oxygen concentration 103
Figure 5.5. CO and NOx emission characteristics of the first stage premixed burner 104
Figure 5.6. Direct images of ethanol spray flame for different oxygen concentration 104
Figure 5.7. Direct photo of open state spray flame (a) and closed state spray flame (b) 105
Figure 5.8. Direct photo of closed state spray flame with 1000 mm length quartz tube 105
Figure 5.9. Direct images of ethanol spray flame regarding the different velocity of... 106
Figure 5.10. OH* chemiluminescence images regarding the different velocity of dilution...(이미지참조) 106
Figure 5.11. Line of sight of OH* intensity regarding the different velocity of dilution...(이미지참조) 107
Figure 5.12. Abel inverted OH* images regarding the different velocity of dilution gas...(이미지참조) 107
Figure 5.13. CH* chemiluminescence images regarding the different velocity of dilution...(이미지참조) 108
Figure 5.14. Line of sight of CH* intensity regarding the different velocity of dilution...(이미지참조) 108
Figure 5.15. CH* chemiluminescence images regarding the different velocity of dilution...(이미지참조) 109
Figure 5.16. CO and NOx emission versus different velocity of dilution gas on the... 109
Figure 5.17. Direct images of ethanol MILD combustion in closed system for different... 110
Figure 5.18. Abel inverted OH*(upper) and CH*(lower) images of ethanol MILD...(이미지참조) 110
Figure 5.19. Line of sight of OH* intensity regarding the different oxygen...(이미지참조) 111
Figure 5.20. Line of sight of CH* intensity regarding the different oxygen...(이미지참조) 111
Figure 5.21. CO and NOx emission versus equivalence ratio on the 37.5 mm velocity... 112
Figure 5.22. CO emission versus equivalence ratio regarding to the diameter of... 112
Figure 5.23. NOx emission versus equivalence ratio regarding to the diameter of... 113
Figure 5.24. Direct images of ethanol MILD combustion in closed system for different... 113
Figure 5.25. OH*(left) and CH*(right) chemiluminescence images of ethanol MILD...(이미지참조) 114
Figure 5.26. Abel inverted OH*(left) and CH*(right) images of ethanol MILD...(이미지참조) 114
Figure 5.27. CO and NOx emission versus thermal load on the 7 % oxygen... 115
Figure 5.28. Real time wall temperature measurement of ethanol MILD combustion in... 116
Figure 5.29. Real time NOx emission characteristics measurement of ethanol MILD... 116
Figure 5.30. Direct photo of ethanol MILD combustion in the furnace system for... 117
Figure 6.1. Simplified modeling of twe stage ethanol MILD combustion system 129
Figure 6.2. Schematic for the computational domain of (a) dimension, (b) mesh... 129
Figure 6.3. FGM data for temperature versus mixture fraction at different oxygen... 130
Figure 7.1. Comparison of spray penetration length between numerical result (lines) and... 138
Figure 7.2. Comparison of sauter mean diameter between numerical result (blank dot)... 139
Figure 7.3. Comparison between numerical result (left) and experimental data (right) 139
Figure 7.4. Comparison of between numerical results of temperature distribution (left)... 140
Figure 7.5. Velocity vector based on CO2 contour regarding the different velocity of... 141
Figure 7.6. Recirculation ratio (Kv) regarding the different velocity of dilution gas 141
Figure 7.7. CO₂ and H₂O profiles regarding the different diameter of velocity control... 142
Figure 7.8. Comparison of between numerical results of temperature distribution (left)... 143
Figure 7.9. Comparison of temperature profile at center line for different oxygen... 143
Figure 7.10. Comparison of OH* distribution between numerical results (right) and...(이미지참조) 144
Figure 7.11. Comparison of CH* distribution between numerical results (right) and...(이미지참조) 144
Figure 7.12. Comparison of CO and NOx emission characteristics between numerical... 145
Figure 7.13. Comparison of CO and NOx emission characteristics between numerical... 145
Figure 7.14. Comparison of between numerical results of temperature distribution at... 146
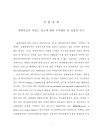
1970년대에 처음 나타난 에너지위기는 핵 및 태양에너지의 개발로 이어졌고, 현재에는 신재생에너지와 신에너지에 대한 관심이 급증하고 있다. 하지만 원자력과 태양 에너지 그리고 신에너지들이 미래에 더 많은 가능성을 제공할 지라도 화석연료의 비 방사능성, 안정성, 높은 에너지 전환효율, 비용 등의 장점들로 인하여 모든 에너지적용분야에서 신속하게 화석연료가 대체 될 수 없는 실정이다. 그럼에도 전 세계적으로 깨끗한 환경에 대한 관심이 높아지고 대기환경문제가 대두되면서 화석연료의 사용으로 배출되는 배기가스에 대한 규제들이 더욱 엄격해지고 있다. 특히 질소산화물(NOx)와 같은 배출물질로 인한 미세먼지에 대한 문제가 심각하다.
이에 따라 최근 화석연료의 연소과정에서 발생되는 공해물질을 저감하는 친환경 연소 및 에너지효율의 증가를 위한 많은 연구들이 진행되고 있다. 이중 가스터빈의 경우 다단연소(Staging combustion)를 통하여 화염의 온도를 저감하여 NOx 배출량을 감소하는 연소기술과 희박 예혼합연소(Lean premixed pre-vaporized combustion)를 통하여 연료소비량 감소 및 NOx의 배출을 저감하는 연소기술에 대한 연구들이 진행되고 있는데 이런 연소기법들은 희박가연한계 부근의 당량비 조건에서 연소가 진행됨에 따라 낮은 공해물질 배출특성에도 불구하고 연소불안정성이 높다는 단점을 가지고 있어 연소불안정성에 대한 문제의 해결이 필요하다. 따라서 본 연구에서는 연소불안정성 문제를 극복하고 낮은 배기가스 배출특성을 갖는 MILD(Moderate or Intense Low-oxygen Dilution) 연소기술을 가스터빈연소기에 적용하고자 하였다. 또한 신재생에너지인 바이오에탄올을 연료로 사용하여 탄소중립의 이점을 확보하여 온실가스배출규제 및 온실가스목표관리제 등 강화되는 배기가스 규정에 대응하고자 하였다. 그러나 현재까지 MILD연소에 관한 대부분의 연구들은 기체연료에 초점을 맞추어 진행되었다. 대부분의 실제 항공기 엔진과 산업발전소의 연소기들이 현재 액체연료로 작동되고 있음에도 액체연료를 사용한 MILD연소기술에 대한 연구가 매우 부족한 실정이다.
본 연구에서는 기존의 MILD연소형성을 위한 중요인자이외에도 액체연료의 분무와 증발과 같은 물리적인 문제들을 추가로 고려하기 위하여 하단에 예혼합 연소기를 적용하여 예혼합 연소 후 발생되는 고온의 연소가스를 통하여 상단의 주 반응구간에 분사되는 에탄올를 연소시키는 2단 연소시스템을 구성하였고 1차원 수치해석, 3차원 수치해석, 실험연구를 통하여 에탄올연료를 사용한 MILD연소시스템에 대한 연구를 진행하였다.
1차원 수치해석을 통하여 에탄올연료의 기본적인 연소특성을 알아보았으며 기연가스의 재순환에 의한 산화제의 희석효과가 MILD연소에 미치는 영향을 알아보았다. OPPDIF code를 사용하여 계산을 진행하였고 재순환율이 증가됨에 따라 발생되는 연소온도가 낮아지고 발생하는 최대 열 방출 값도 재순환율이 증가됨에 따라 낮아지는 것을 확인하였다. 또한 MILD연소가 형성되면 발생되는 열 방출의 Pyrolysis영역이 사라지며 두 개의 열방출 피크가 하나로 합쳐지는 현상을 확인하였다. 이러한 Pyrolysis 분석을 통하여 공급온도와 발생온도와의 차이로 구분되는 기존의 MILD연소 맵을 에탄올에 해당하는 MILD연소영역을 특정할 수 있었다.
2단구조의 에탄올 MILD연소시스템의 실험을 통하여 외부공기 유입이 차단된 밀폐시스템에서 공급되는 희석가스의 유속이 증가함에 따라 에탄올스프레이화염이 밀폐시스템 내부에 안정적으로 형성되었으며 희미한 청색의 화염이미지와 낮은 OH* 및 CH* 강도를 보이는 MILD연소를 형성함을 확인하였다. 또한 희석가스의 산소농도가 감소함에 따라 발생되는 에탄올스프레이의 화염이 더 넓게 형성되며 OH* 및 CH* 강도가 감소되는 MILD연소의 특징을 뚜렷하게 나타냈다. 에탄올 MILD연소를 형성함에 따라 배출되는 CO 및 NOx 배출량이 감소하는 경향을 보였고 NOx의 경우 50 mm이하의 velocity control adapter 조건의 모든 산소농도에서 10 ppm이하의 매우 낮은 배출량을 보였다. 실제 연소시스템을 가정하여 단열로를 적용한 지속실험을 진행한 결과 벽면온도가 증가됨에 따라 발생되는 에탄올화염이 거의 보이지 않게 되는 것을 확인하였고 분위기온도의 증가에도 배출되는 NOx의 양이 증가하지 않고 6 ppm의 낮은 배출특성을 유지하였다. 따라서 벽면온도조건이 최적의 에탄올 MILD연소를 형성하는 중요한 인자임을 파악하였다.
3차원 수치해석을 통하여 실험결과로 얻어진 에탄올 MILD연소의 형성에 대하여 보다 자세한 분석을 하고자 하였고 먼저 3차원 수치해석의 온도분포 및 OH* 및 CH*분포의 실험결과와 비교를 통하여 실험결과를 비교적 잘 예측하고 있음을 확인하였다. 희석가스의 공급유속의 증가는 내부 재순환유동을 강하게 형성하여 재순환되는 CO 및 H2O를 증가시키고 유동에 의한 Kv가 증가됨으로 에탄올 MILD연소가 형성되게 하였다. 희석가스의 산소농도가 6 %로 감소하게 되면 발생되는 에탄올화염의 최고온도가 1600 K이하로 감소하게 되고 연소장 전체에 비교적 균일한 온도분포를 형성함으로 에탄올 MILD연소를 형성함을 확인하였다. 수치해석의 배기가스 배출특성이 실험결과를 잘 예측하였으며 NOx의 경우 10 ppm 미만의 single digit수준의 배출량을 보였다.
본 연구에서 수행된 수치해석과 실험적 연구결과를 통하여 액체연료인 에탄올을 적용한 MILD연소형성에 대한 중요인자를 이해하고 실제 가스터빈 연소기에 적용할 수 있는 기초 데이터를 확보하였으며 실제 가스터빈연소시스템으로의 적용가능성과 그 방향을 제시하였다.*표시는 필수 입력사항입니다.
| 전화번호 |
|---|
| 기사명 | 저자명 | 페이지 | 원문 | 기사목차 |
|---|
| 번호 | 발행일자 | 권호명 | 제본정보 | 자료실 | 원문 | 신청 페이지 |
|---|
도서위치안내: / 서가번호:

우편복사 목록담기를 완료하였습니다.
*표시는 필수 입력사항입니다.
저장 되었습니다.
