
 대표어
대표어


권호기사보기
| 기사명 | 저자명 | 페이지 | 원문 | 기사목차 |
|---|
결과 내 검색
동의어 포함
표제지
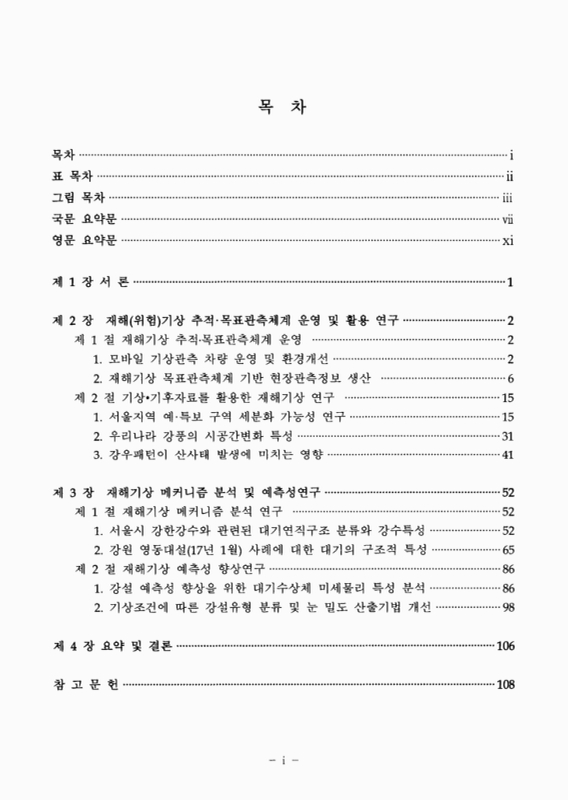
목차
요약문 9
Summary 13
제1장 서론 19
제2장 재해(위험)기상 추적·목표관측체계 운영 및 활용 연구 20
제1절 재해기상 추적·목표관측체계 운영 20
1. 모바일 기상관측 차량 운영 및 환경개선 20
2. 재해기상 목표관측체계 기반 현장관측정보 생산 24
제2절 기상·기후자료를 활용한 재해기상 연구 33
1. 서울지역 예·특보 구역 세분화 가능성 연구 33
2. 우리나라 강풍의 시공간변화 특성 49
3. 강우패턴이 산사태 발생에 미치는 영향 59
제3장 재해기상 메커니즘 분석 및 예측성연구 70
제1절 재해기상 메커니즘 분석 연구 70
1. 서울시 강한강수와 관련된 대기연직구조 분류와 강수특성 70
2. 강원 영동대설(17년 1월) 사례에 대한 대기의 구조적 특성 83
제2절 재해기상 예측성 향상연구 104
1. 강설 예측성 향상을 위한 대기수상체 미세물리 특성 분석 104
2. 기상조건에 따른 강설유형 분류 및 눈 밀도 산출기법 개선 116
제4장 요약 및 결론 124
참고문헌 126
Fig. 2.1.1.1. The operational distance between each observation vehicle. 20
Fig. 2.1.1.2. The number of operational days for MOVE1. 21
Fig. 2.1.1.3. The operational distance of MOVE1 per month. 21
Fig. 2.1.1.4. The training workshop for mobile observation vehicle operation. 22
Fig. 2.1.1.5. Cover for protecting vane anemometer. 23
Fig. 2.1.1.6. The picture of installed display system for briefing. 24
Fig. 2.1.2.1. Observation points for typhoon cases. 25
Fig. 2.1.2.2. The observation and data production for typhoon cases. 26
Fig. 2.1.2.3. The pictures of forest fire support(Inje, Gangneung, Sokcho, Goseong). 28
Fig. 2.1.2.4. BBMEX observation path(left) and press interview(right). 29
Fig. 2.1.2.5. The pictures of observations for heavy snow(Hyeonnae, Sokcho, Chuncheon, Haean). 30
Fig. 2.1.2.6. Upper-air observation in Sokcho based on MOVE1 for 3-D Meteorological Observation... 31
Fig. 2.1.2.7. The observation sites and upper air observation for Charyeong Ccampaign in Asan... 32
Fig. 2.2.1.1. The frequency of accidents caused by heavy rain. 34
Fig. 2.2.1.2. Observation points used in the study. 35
Fig. 2.2.1.3. Frequency of cases exceeding the heat wave weather alert criteria. 40
Fig. 2.2.1.4. Frequency of cases exceeding the cold wave weather alert criteria. 40
Fig. 2.2.1.5. Frequency of cases exceeding the heavy rainfall weather alert criteria. 41
Fig. 2.2.1.6. Results of duster analysis based on branch data. 42
Fig. 2.2.1.7. Daily average temperature data interpolated by... 45
Fig. 2.2.1.8. Result of SPOT Analysis. 46
Fig. 2.2.1.9. Results of grouping analysis. 47
Fig. 2.2.2.1. Location of surface observation stations... 51
Fig. 2.2.2.2. Annual frequencies of maximum wind speed and... 52
Fig. 2.2.2.3. Seasonal frequencies of maximum wind speed with its trend 54
Fig. 2.2.2.4. Seasonal frequencies of maximum instantaneous wind speed with its trend 54
Fig. 2.2.2.5. Monthly frequencies of maximum wind(Max. W) speed and maximum... 55
Fig. 2.2.2.6. Hourly frequencies of maximum wind(Max. W) speed and maximum... 56
Fig. 2.2.2.7. Variations of monthly averaged maximum instantaneous wind speed and its trends... 57
Fig. 2.2.3.1. Landslide trend in recent 10 years. 59
Fig. 2.2.3.2. Rainfall patterns in landslide cases 65
Fig. 2.2.3.3. The rainfall pattern when landslides did not occur. 66
Fig. 3.1.1.1. The location of meteorological station in Seoul(red dot)... 72
Fig. 3.1.1.2. Flowchart showing the criteria for identifying the "LG", "TT", and "IV"... 73
Fig. 3.1.1.3. Flowchart showing procedure for calculating Rainfall type Index (RI). 75
Fig. 3.1.1.4. Examples for the interpretation of Rainfall type Index (RI, a... 77
Fig. 3.1.1.5. Mean vertical profiles of mixing ratio (a), wind speed (b), and equivalent potential... 78
Fig. 3.1.1.6. Composited geopotentail height fields (white solid line) of Loaded Gun-type for the... 80
Fig. 3.1.1.7. The same as in Fig. 3.1.1.6, but for Thin Tube-type. 80
Fig. 3.1.1.8. The same as in Fig. 3.1.1.6, but for Inverted V-type. 81
Fig. 3.1.2.1. Qrganization Chart of the International Collaborative Experiments for... 84
Fig. 3.1.2.2. Distribution of (a) daily precipitation(mm) in Korea and time series of (b)... 91
Fig. 3.1.2.3. Surface weather chart for (a) 03 KST, (b) 09 KST, (c) 15 KST, and... 92
Fig. 3.1.2.4. The same as in Fig. 3.1.2.3. except for 850 hPa. 94
Fig. 3.1.2.5. The same as in Fig. 3.1.2.3. except for 500 hPa. 95
Fig. 3.1.2.6. The same as in Fig. 3.1.2.3. except for 300 hPa. 96
Fig. 3.1.2.7. Potential vorticity (color) and wind vector (arrow) on isentropic surface... 98
Fig. 3.1.2.8. East-west vertical cross section of vertical velocity(×10⁻³hPas⁻¹) at (a) 21 KST... 99
Fig. 3.1.2.9. The same as in Fig. 3.1.2.8 except for relative vorticity(×10⁻⁵s⁻¹). The dotted (solid)... 100
Fig. 3.1.2.10. The same as in Fig. 3.1.2.8. except for divergence(×10⁻⁵s⁻¹). The dotted (solid)... 101
Fig. 3.2.1.1. The model domain and topography with... 106
Fig. 3.2.1.2. Comparison of mesoscale model (MSM) fields in the (a, c, e) (CTRL),... 109
Fig. 3.2.1.3. Time series of (a) thermodynamic profiles, (b) snow and... 111
Fig. 3.2.1.4. The same as in Fig. 3.2.1.3a except for CReSS simulations for the (a) CTRL,... 112
Fig. 3.2.1.5. Time series of 3-h accumulated precipitation of rain, graupel, and snow derived... 113
Fig. 3.2.1.6. Vertical profiles of mixing ratio of water vapor... 114
Fig. 3.2.2.1. Observation stations(17 stations) used in the study. 117
Fig. 3.2.2.2. Indicates the rain type(red dot) estimated WW and wet-bulb... 120
Fig. 3.2.2.3. Indicates (a) wet-bulb temperature(blue line) of 28 February, 2018 case of DGW and... 121
Fig. 3.2.2.4. Indicates the spatial distribution of the case on February 28, 2018. Color bar... 122
| 등록번호 | 청구기호 | 권별정보 | 자료실 | 이용여부 |
|---|---|---|---|---|
| 0002634099 | 551.64 -20-4 | 서울관 서고(열람신청 후 1층 대출대) | 이용가능 | |
| 0002634100 | 551.64 -20-4 | 서울관 서고(열람신청 후 1층 대출대) | 이용가능 |
*표시는 필수 입력사항입니다.
| 전화번호 |
|---|
| 기사명 | 저자명 | 페이지 | 원문 | 기사목차 |
|---|
| 번호 | 발행일자 | 권호명 | 제본정보 | 자료실 | 원문 | 신청 페이지 |
|---|
도서위치안내: / 서가번호:

우편복사 목록담기를 완료하였습니다.
*표시는 필수 입력사항입니다.
저장 되었습니다.
