
 대표어



권호기사보기
| 기사명 | 저자명 | 페이지 | 원문 | 기사목차 |
|---|
결과 내 검색
동의어 포함
[표지]
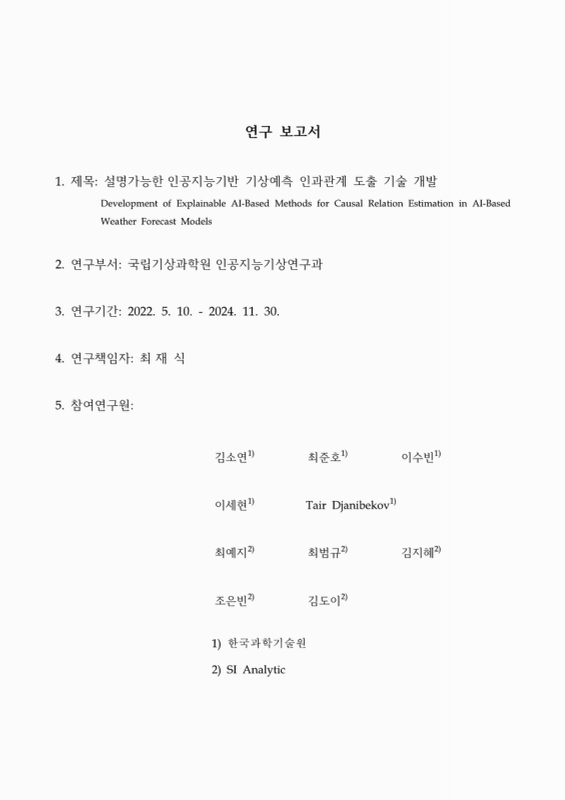
연구 보고서
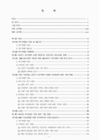
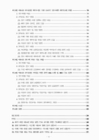
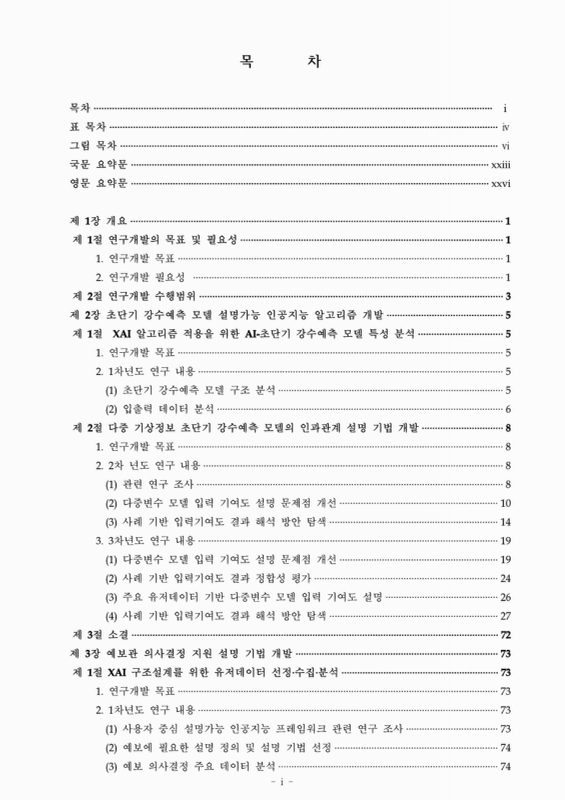
목차
요약문 25
Summary 28
제1장 개요 31
제1절 연구개발의 목표 및 필요성 31
1. 연구개발 목표 31
2. 연구개발 필요성 31
제2절 연구개발 수행범위 33
제2장 초단기 강수예측 모델 설명가능 인공지능 알고리즘 개발 35
제1절 XAI 알고리즘 적용을 위한 AI-초단기 강수예측 모델 특성 분석 35
1. 연구개발 목표 35
2. 1차년도 연구 내용 35
제2절 다중 기상정보 초단기 강수예측 모델의 인과관계 설명 기법 개발 38
1. 연구개발 목표 38
2. 2차 년도 연구 내용 38
3. 3차년도 연구 내용 49
제3절 소결 102
제3장 예보관 의사결정 지원 설명 기법 개발 103
제1절 XAI 구조설계를 위한 유저데이터 선정·수집·분석 103
1. 연구개발 목표 103
2. 1차년도 연구 내용 103
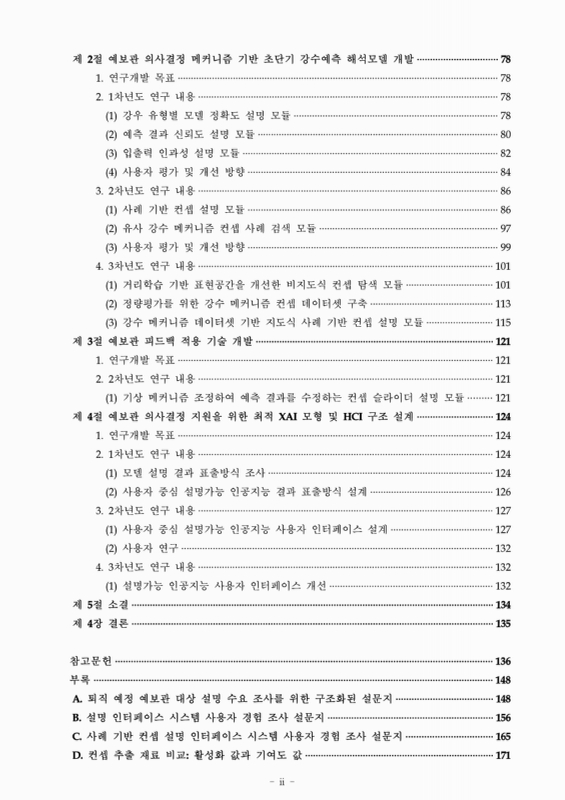
제2절 예보관 의사결정 메커니즘 기반 초단기 강수예측 해석모델 개발 108
1. 연구개발 목표 108
2. 1차년도 연구 내용 108
3. 2차년도 연구 내용 116
4. 3차년도 연구 내용 131
제3절 예보관 피드백 적용 기술 개발 151
1. 연구개발 목표 151
2. 2차년도 연구 내용 151
제4절 예보관 의사결정 지원을 위한 최적 XAI 모형 및 HCI 구조 설계 154
1. 연구개발 목표 154
2. 1차년도 연구 내용 154
3. 2차년도 연구 내용 157
4. 3차년도 연구 내용 162
제5절 소결 164
제4장 결론 165
참고문헌 166
부록 178
A. 퇴직 예정 예보관 대상 설명 수요 조사를 위한 구조화된 설문지 178
B. 설명 인터페이스 시스템 사용자 경험 조사 설문지 186
C. 사례 기반 컨셉 설명 인터페이스 시스템 사용자 경험 조사 설문지 195
D. 컨셉 추출 재료 비교 : 활성화 값과 기여도 값 201
E. 비지도식 컨셉 추출 결과 사례(2차년도) 202
F. 비지도식 컨셉 추출 결과 사례(3차년도) 209
G. 예보분석서 기반 강수 메커니즘 컨셉 데이터셋 예시 212
H. 세그멘테이션 모델을 위한 Wrapper 함수 224
[뒷표지] 227
Fig. 1.1. Damage costs by type of natural disaster worldwide. 31
Fig. 1.2. The need for explainable artificial intelligence in weather forecasting environment.... 32
Fig. 1.3. The need for explainable AI weather forecasting 33
Fig. 1.4. Three years of research process 34
Fig. 2.1. Convolutional neural networks-based rainfall forecasting model structure 35
Fig. 2.2. An example of input data and labels 36
Fig. 2.3. Input domain for the study. The... 37
Fig. 2.4. The range of input values of train dataset 37
Fig. 2.5. Differences in spatial distribution of input contribution according to... 42
Fig. 2.6. Jangma and typhoon cases. Comparison of observed(GT) and forecast... 45
Fig. 2.7. Confusion matrix for Jangma and Typhoon cases 46
Fig. 2.8. Comparison of true values of radar input for each input time period in the... 47
Fig. 2.9. Comparison of true values of satellite input(IR105) for each input time... 47
Fig. 2.10. Comparison of true values of satellite input(BTD4) for each input time... 48
Fig. 2.11. Comparison of true values of satellite input(BTD1) for each input time... 48
Fig. 2.12. Visualization of ERA5 Single level(KST 2020.09.06. 09:00) 50
Fig. 2.13. Visualization of ERA5 Pressure level(KST 2020.09.06. 09:00) 50
Fig. 2.14. Visualization of the original data of GK2A IR105, IR112, WW0B3 channels(KST... 51
Fig. 2.15. BTD channel visualization(KST 2020.09.06. 09:00) 51
Fig. 2.16. Comparison of regions between GK2A image(Gray) and ERA5(Color) 53
Fig. 2.17. Cyclonic rainfall KST 2020.06.29. 21:00 54
Fig. 2.18. Convective type KST 2020.07.29. 17:00 55
Fig. 2.19. Orographical effect type KST 2020.08.11. 09:00 55
Fig. 2.20. Frontal type KST 2020.09.17. 15:00 56
Fig. 2.21. The two cases for analyzing the feature contributions in the low-pressure rainfall 58
Fig. 2.22. Distribution of the top 5 feature contributions over time for each class... 59
Fig. 2.23. Distribution of the top 5 feature contributions over time for each class... 60
Fig. 2.24. Comparison of key feature distributions over time in two... 61
Fig. 2.25. Spatial distribution of major feature contributions for class1 in the... 63
Fig. 2.26. Spatial distribution of major feature contributions for class2 in the... 64
Fig. 2.27. Common and individual spatial distributions of key features over time for... 65
Fig. 2.28. Common and individual spatial distributions of key features over time for... 65
Fig. 2.29. Spatial distribution of major feature contributions for class1 in the... 66
Fig. 2.30. Spatial distribution of major feature contributions for class2 in the... 67
Fig. 2.31. Common and individual spatial distributions of key features over time for... 68
Fig. 2.32. Cyclonic rainfall cases(2020.07.10. 06:00 KST). The spatial... 68
Fig. 2.33. The two cases for analyzing the feature contributions in the convective rainfall 69
Fig. 2.34. Distribution of the top5 feature contributions over time for each class in the... 70
Fig. 2.35. Distribution of the top 5 feature contributions over time for each class in the... 71
Fig. 2.36. Comparison of key feature distributions over time in two convective... 72
Fig. 2.37. Spatial distribution of major feature contributions for class1 in the... 73
Fig. 2.38. Spatial distribution of major feature contributions for class2 in the... 74
Fig. 2.39. Common and individual spatial distributions of key features over time for... 75
Fig. 2.40. Common and individual spatial distributions of key features over time for... 75
Fig. 2.41. Spatial distribution of major feature contributions for class1 in the... 76
Fig. 2.42. Spatial distribution of major feature contributions for class2 in the convective... 77
Fig. 2.43. Common and individual spatial distributions of key features over time for... 78
Fig. 2.44. Common and individual spatial distributions of key features over time for... 78
Fig. 2.45. The two cases for analyzing the feature contributions in the orographic rainfall 79
Fig. 2.46. Distribution of the top 5 feature contributions over time for each class... 80
Fig. 2.47. Key input features for each class in the orographic rainfall case... 81
Fig. 2.48. Distribution of the top 5 feature contributions over time for each class in... 82
Fig. 2.49. Comparison of key feature distributions over time in two orographic rainfall cases 83
Fig. 2.50. Spatial distribution of major feature contributions for class1 in the... 84
Fig. 2.51. Spatial distribution of major feature contributions for class2 in the... 85
Fig. 2.52. Common and individual spatial distributions of key features over time for... 86
Fig. 2.53. Common and individual spatial distributions of key features over time for... 86
Fig. 2.54. Spatial distribution of major feature contributions for class1 in the orographic... 88
Fig. 2.55. Spatial distribution of major feature contributions for class2 in the orographic... 89
Fig. 2.56. Common and individual spatial distributions of key features over time for... 90
Fig. 2.57. Common and individual spatial distributions of key features over time for... 90
Fig. 2.58. The two cases for analyzing the feature contributions in the frontal rainfall 91
Fig. 2.59. Distribution of the top 5 feature contributions over time for each class in... 92
Fig. 2.60. Distribution of the top 5 feature contributions over time for each class in... 94
Fig. 2.61. Comparison of key feature distributions over time in two frontal rainfall cases 95
Fig. 2.62. Spatial distribution of major feature contributions for class1 in the frontal rainfall... 96
Fig. 2.63. Spatial distribution of major feature contributions for class2 in the frontal... 97
Fig. 2.64. Common and individual spatial distributions of key features over time for... 98
Fig. 2.65. Common and individual spatial distributions of key features over time for... 98
Fig. 2.66. Spatial distribution of major feature contributions for class1 in the frontal... 99
Fig. 2.67. Spatial distribution of major feature contributions for class2 in the frontal... 100
Fig. 2.68. Common and individual spatial distributions of key features over time for... 101
Fig. 2.69. Common and individual spatial distributions of key features over time for... 101
Fig. 3.1. Research process of development of user-centric explainable AI 104
Fig. 3.2. NCEP/DOE Reanalysis 2 model 2m tem perature 106
Fig. 3.3. NCEP/DOE Reanalysis 2 model K Index 106
Fig. 3.4. KIM GDAPS 850nhPa wind flow streamline and wind speed 106
Fig. 3.5. KIM GDAPS auxiliary weather chart and 850hPa convergence 106
Fig. 3.6. Examples of CAPPI and RHI 107
Fig. 3.7. Left : 1.5km height CAPPI radar reflection(shaded color) and horizontal wind distribution... 107
Fig. 3.8. GK2A Infrared Channel 105(Clear-Sky Window) 108
Fig. 3.9. GK2A Daytime Natural Color RGB Channel 108
Fig. 3.10. The structure of the precipitation classifier (a) and the resulting confusion matrix (b). The... 109
Fig. 3.11. Performance diagram. The diagram helps visualize the overall performance of bias, CSI,... 109
Fig. 3.12. The case of 2020-08-07 at 14:00 UTC with temperature scaling 112
Fig. 3.13. Feature attribution. The heatmap describes the location and the degree of relevance of... 113
Fig. 3.14. Quantitative evaluation of the output reasoning explan... 113
Fig. 3.15. Anecdotal evidence based on domain expert's case analysis of monsoon front and extratr... 114
Fig. 3.16. Survey results of the user experience of the prototype for an explainable artificial intellige... 115
Fig. 3.17. Survey results on the demand of 23 items of explainable artificial intelligence among... 116
Fig. 3.18. The need of instance segmentation for each rain... 118
Fig. 3.19. Manifold learning applied to the input feature space, with colors overlaid to... 120
Fig. 3.20. An example of post-forecast document for weather concept evaluation... 121
Fig. 3.21. Concept activation vector(υlc)) and its linear classifier[이미지참조] 122
Fig. 3.22. Histogram of the coefficients of linear classifiers using... 123
Fig. 3.23. Accuracy of each linear classifier on the test dataset. 124
Fig. 3.24. P-value of pairwise t-Test for each concept pair.... 126
Fig. 3.25. Frequency of the pixels of each target class of ground truth... 126
Fig. 3.26. Survey results of Q1 and Q2 of identi... 131
Fig. 3.27. Survey results of Q4 of comparing the... 131
Fig. 3.28. The heatmap of cosine similarities of human annotated concept label pairs. The cosin... 132
Fig. 3.29. The outline of multi-label deep clustering with soft-shilhouette coefficient 135
Fig. 3.30. Manifold of the embedding vector spaces at each stage of the proposed representation... 136
Fig. 3.31. Manifold of the embedding vector spaces colorized by three human-annotated label data... 137
Fig. 3.32. Examples of top-three nearest neighbors from four query samples measured by distance... 138
Fig. 3.33. Examples in the fine-tuned feature space. Four labels are visualized in this figure to analy... 139
Fig. 3.34. Examples of lake-effect-snowfall, sea-breeze-convergence, and east-coast-rainfall in th... 140
Fig. 3.35. Comparison of polar low and typhoon cases. The score refers to the probabilistic score... 141
Fig. 3.36. Additional identification test of concept prober #19 : a comparison between polar low cas... 141
Fig. 3.37. Sample questions form the structured questionnaires for user evaluation of extracted conc... 142
Fig. 3.38. Accuracy of classifying heterogeneous an... 143
Fig. 3.39. The number of samples of human-annotated concept labels. In the legend, 'POSTHOC'... 145
Fig. 3.40. Examples of neighbor search engine and probabilistic concept explanations. The firs... 148
Fig. 3.41. Importance score of concept activation vectors for each concept. The... 150
Fig. 3.42. Importance score of concept activation vectors(cont.) 150
Fig. 3.43. Perturbation test on the Ost concept activation vector 152
Fig. 3.44. Perturbation test on the 1st concept activation vector 152
Fig. 3.45. Perturbation test on the 2nd concept activation vector 152
Fig. 3.46. Perturbation test on the 4th concept activation vector 153
Fig. 3.47. Perturbation test on the 8th concept activation vector 153
Fig. 3.48. Perturbation test on the 11th concept activation vector 153
Fig. 3.49. Monitoring panel of Amazon SageMaker Clarify service's input data drift 154
Fig. 3.50. Monitoring panel of Amazon SageMaker Clarify service's input attribution change 155
Fig. 3.51. Monitoring panel of Google Cloud Console service's input attribution 155
Fig. 3.52. Human computer interaction interface of similar image search explanation system in medic 156
Fig. 3.53. Design plaan of visualization of explanation modules of model accuracy and... 157
Fig. 3.54. Design plan of visualization of input attribution module 157
Fig. 3.55. Use case diagram of user interface system 158
Fig. 3.56. Design and operational scenarios for the forecaster's decision support interface system architecture 159
Fig. 3.57. User interface prototype design proposal(1st alt.) 160
Fig. 3.58. User interface prototype design proposal(2nd alt.) 161
Fig. 3.59. Survey results of Q5 about the user experience of... 162
Fig. 3.60. Use case design for user interface 163
Fig. 3.61. User interface prototype design proposal(3rd alt.) 163
Fig. A.1. Structured questionnaire for survey focused on retiree-to-be forecasters 179
Fig. A.2. Structured questionnaire for survey focused on retiree-to-be forecasters(cont.) 180
Fig. A.3. Structured questionnaire for survey focused on retiree-to-be forecasters(cont.) 181
Fig. A.4. Structured questionnaire for survey focused on retiree-to-be forecasters(cont.) 182
Fig. A.5. Structured questionnaire for survey focused on retiree~to-be forecasters(cont.) 183
Fig. A.6. Structured questionnaire for survey focused on retiree-to-be forecasters(cont.) 184
Fig. A.7. Structured questionnaire for survey focused on retiree-to-be forecasters(cont.) 185
Fig. B.1. Questionnaire design for user experience on explainable AI interface system 186
Fig. B.2. Structured questionnaire for user experience on explainable AI... 187
Fig. B.3. Structured questionnaire for user... 188
Fig. B.4. Structured questionnaire for user experience on explainable AI... 189
Fig. B.5. Structured questionnaire for user experience on explainable AI... 190
Fig. B.6. Structured questionnaire for user experience on explainable AI... 191
Fig. B.7. Structured questionnaire for user experience on explainable AI... 192
Fig. B.8. Structured questionnaire for user experience on explainable AI... 193
Fig. B.9. Structured questionnaire for user experience on explainable AI... 194
Fig. C.1. Structured questionnaire for survey of user experience on example-based... 195
Fig. C.2. Structured questionnaire for survey of user experience on example-based... 196
Fig. C.3. Structured questionnaire for survey of user... 197
Fig. C.4. Structured questionnaire for survey of user... 198
Fig. C.5. Structured questionnaire for survey of user experience... 199
Fig. C.6. Structured questionnaire for survey of user experience... 200
Fig. E.1. Manifold topology of activation and relevance space. From left to right : result on... 201
Fig. E.2. Visualization of input feature data for each cluster(from top to bottom, corresponding... 202
Fig. E.3. Visualization of input feature data for each cluster(from top to bottom, corresponding... 203
Fig. E.4. Visualization of input feature data for each cluster(from top to bottom, corresponding... 204
Fig. E.5. Visualization of input feature data for each cluster(from top to bottom, corresponding... 205
Fig. E.6. Visualization of input feature data for each cluster(from top to bottom, corresponding... 206
Fig. E.7. Visualization of input data for each cluster(from top-left to bottom-right, corresponding... 207
Fig. E.8. Visualization of input data for each cluster(from top-left to bottom-right, corresponding... 208
Fig. F.1. The statistics of clustered instances on the human annotated concept evaluation labels. N... 209
Fig. F.2. Example instances of 24 clusters. The date time is in UTC. 210
Fig. F.3. Example instances of 24 clusters. The date time is in UTC.(Cont.) 211
Fig. F.4. The samples of changma concept in the weather evaluation label dataset. Changma is als... 212
Fig. F.5. The samples of stationary-front concept in the weather evaluation label dataset. A stationa... 213
Fig. F.6. The samples of cold-front concept in the weather evaluation label dataset. A cold front is... 214
Fig. F.7. The samples of warm-front concept in the weather evaluation label dataset. A warm front... 214
Fig. F.8. The samples of typhoon concept in the weather evaluation label dataset. Typhoons are int... 215
Fig. F.9. The samples of cyclonic concept in the weather evaluation label dataset. Cyclonic precipit... 216
Fig. F.10. The samples of scattered-shower concept in the weather evaluation label dataset. Scatte... 216
Fig. F.11. The samples of drizzle concept in the weather evaluation label dataset. Drizzle refers to... 217
Fig. F.12. The samples of convectional concept in the weather evaluation label dataset. Convection... 218
Fig. F.13. The samples of scattered-shower concept in the weather evaluation label dataset. Scatte... 219
Fig. F.14. The samples of sea-breeze-convergence concept in the weather evaluation label datase.... 219
Fig. F.15. The samples of east-coast-rainfall concept in the weather evaluation label dataset. East... 220
Fig. F.16. The samples of lake-effect-snowfall concept in the weather evaluation label dataset. Lak... 221
Fig. F.17. The samples of upper-low-jet-coupling concept in the weather evaluation label dataset.... 222
Fig. F.18. The samples of low-level-jet concept in the weather evaluation label dataset. Low-level... 223
Fig. F.19. The samples of maintenance concept in the weather evaluation label dataset. The continu... 224

※ 출처: 상단의 서지정보에서 확인
※ 원저작물에 적용된 공공누리 유형: 제2유형
| 등록번호 | 청구기호 | 권별정보 | 자료실 | 이용여부 |
|---|---|---|---|---|
| 0003178383 | 551.630285 -25-1 | v.3 | 서울관 인문자연과학자료실(314호) | 이용가능 |
| 0003178384 | 551.630285 -25-1 | v.3 | 서울관 인문자연과학자료실(314호) | 이용가능 |
*표시는 필수 입력사항입니다.
| 전화번호 |
|---|
| 기사명 | 저자명 | 페이지 | 원문 | 기사목차 |
|---|
| 번호 | 발행일자 | 권호명 | 제본정보 | 자료실 | 원문 | 신청 페이지 |
|---|
도서위치안내: 인문자연과학자료실(314호) / 서가번호: 33

우편복사 목록담기를 완료하였습니다.
*표시는 필수 입력사항입니다.
저장 되었습니다.
