
 대표어

권호기사보기
| 기사명 | 저자명 | 페이지 | 원문 | 기사목차 |
|---|
결과 내 검색
동의어 포함
[표지]
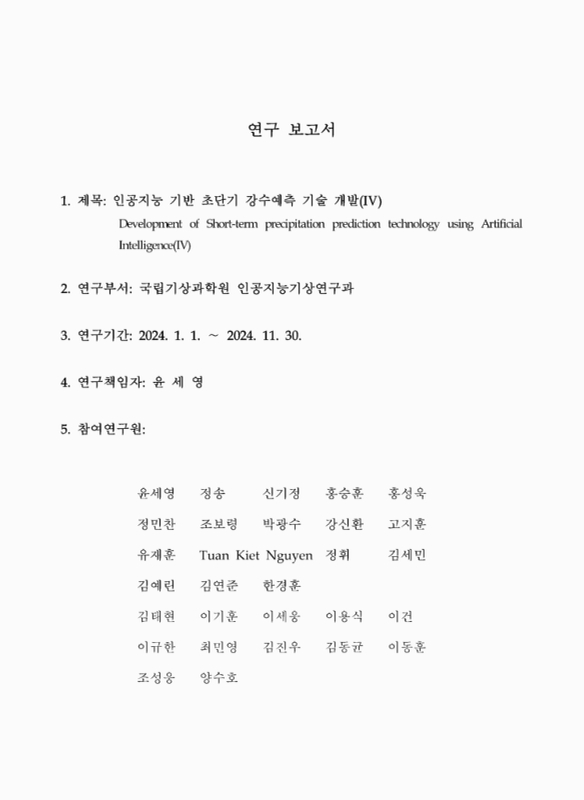
연구 보고서
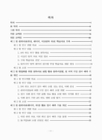
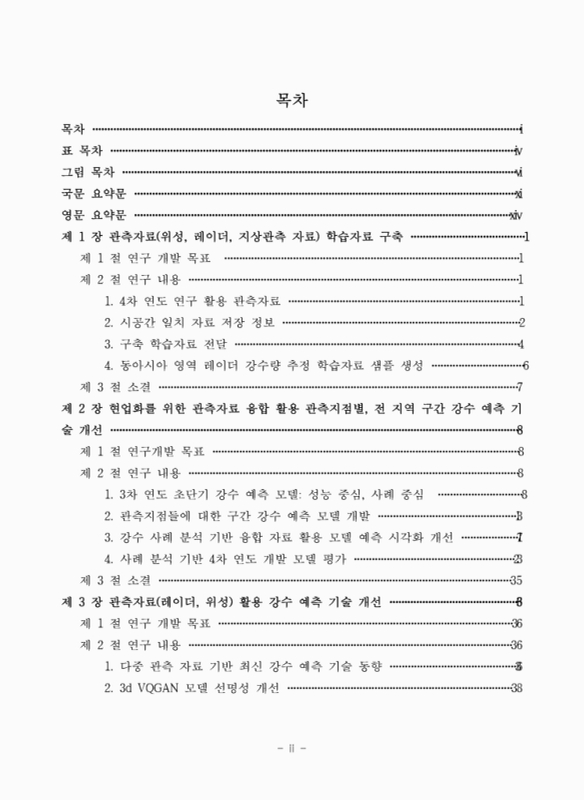
목차
요약문 14
Summary 18
제1장 관측자료(위성, 레이더, 지상관측 자료) 학습자료 구축 23
제1절 연구 개발 목표 23
제2절 연구 내용 23
1. 4차 연도 연구 활용 관측자료 23
2. 시공간 일치 자료 저장 정보 24
3. 구축 학습자료 전달 26
4. 동아시아 영역 레이더 강수량 추정 학습자료 샘플 생성 28
제3절 소결 29
제2장 현업화를 위한 관측자료 융합 활용 관측지점별, 전 지역 구간 강수 예측 기술 개선 30
제1절 연구개발 목표 30
제2절 연구 내용 30
1. 3차 연도 초단기 강수 예측 모델 : 성능 중심, 사례 중심 30
2. 관측지점들에 대한 구간 강수 예측 모델 개발 35
3. 강수 사례 분석 기반 융합 자료 활용 모델 예측 시각화 개선 39
4. 사례 분석 기반 4차 연도 개발 모델 평가 45
제3절 소결 57
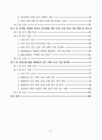
제3장 관측자료(레이더, 위성) 활용 강수 예측 기술 개선 58
제1절 연구 개발 목표 58
제2절 연구 내용 58
1. 다중 관측 자료 기반 최신 강수 예측 기술 동향 58
2. 3d VQGAN 모델 선명성 개선 60
3. 강수예측 트랜스포머 정확도 개선 62
4. 최종 모델 개발 및 24년 5-9월 테스트베드 검증 69
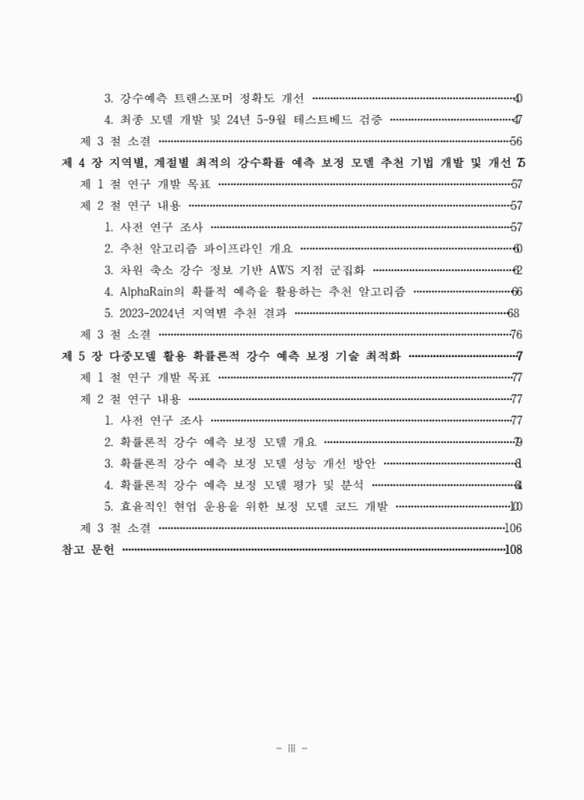
제3절 소결 78
제4장 지역별, 계절별 최적의 강수확률 예측 보정 모델 추천 기법 개발 및 개선 79
제1절 연구 개발 목표 79
제2절 연구 내용 79
1. 사전 연구 조사 79
2. 추천 알고리즘 파이프라인 개요 82
3. 차원 축소 강수 정보 기반 AWS 지점 군집화 84
4. AlphaRain의 확률적 예측을 활용하는 추천 알고리즘 88
5. 2023-2024년 지역별 추천 결과 90
제3절 소결 98
제5장 다중모델 활용 확률론적 강수 예측 보정 기술 최적화 99
제1절 연구 개발 목표 99
제2절 연구 내용 99
1. 사전 연구 조사 99
2. 확률론적 강수 예측 보정 모델 개요 101
3. 확률론적 강수 예측 보정 모델 성능 개선 방안 103
4. 확률론적 강수 예측 보정 모델 평가 및 분석 106
5. 효율적인 현업 운용을 위한 보정 모델 코드 개발 122
제3절 소결 128
참고 문헌 130
[뒷표지] 133
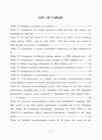
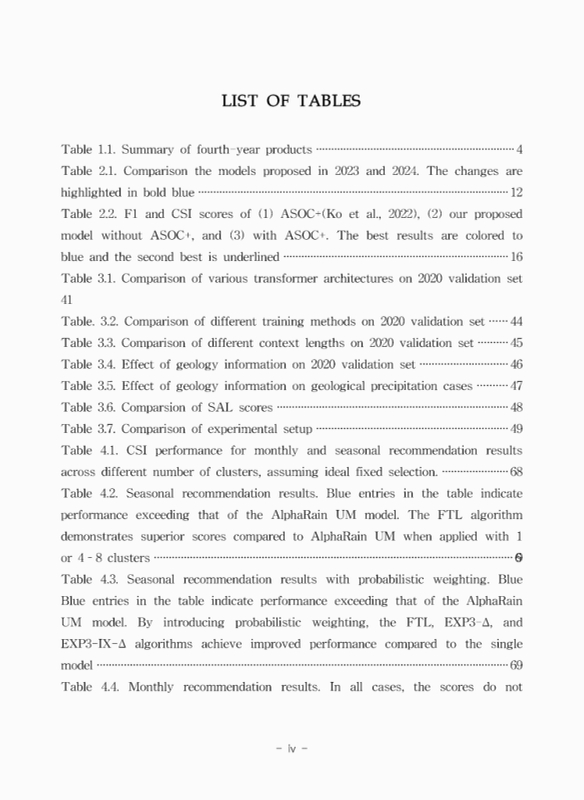
Fig. 1.1. Example of radar and satellite data from July 13, 2023 at 04:00 UTC 25
Fig. 1.2. Schematic diagram of the folder structure 27
Fig. 1.3. Examples of Regional Generation and Ground Radar... 28
Fig. 1.4. Data acquisition status over the entire period 29
Fig. 2.1. Architecture of SimVP 31
Fig. 2.2. Performance of SimVP compared to transformer models. 31
Fig. 2.3. Comparison the ground truth to the prediction of the proposed... 33
Fig. 2.4. Training process of the model focused on the sharpness 33
Fig. 2.5. Example of prediction for all regions (left)... 35
Fig. 2.6. Objective function that considers the difference between two pixels 36
Fig. 2.7. Overview of the proposed model utilizing ground observation data 37
Fig. 2.8. Illustration for fusing additional data with 한중일 합성장 40
Fig. 2.9. Example for showing meaningless grid pattern of the sharpness... 40
Fig. 2.10. Example for collapsing predictions after 5 hours of the sharpness... 41
Fig. 2.11. Objective function that considers the ground truth precipitation 42
Fig. 2.12. Comparison of the average of Power Spectral Density (PSD) at lead... 43
Fig. 2.13. Visualizations of two models proposed in 2023 (left) and... 43
Fig. 2.14. Ground truth images and visualizations of two models proposed in... 44
Fig. 2.15. Ground truth images and visualizations of two models proposed in... 45
Fig. 2.16. Comparison of log(BIAS) scores between models... 45
Fig. 2.17. Case 1 (June 14, 2020, at 08:00 KST). Ground truth images (top),... 46
Fig. 2.18. Case 2 (August 29, 2020, at 16:00 KST). Ground truth images... 47
Fig. 2.19. Case 3 (August 10, 2020, at 12:00 KST). Ground truth images... 48
Fig. 2.20. Case 4 (August 28, 2020, at 19:00 KST). Ground truth images... 49
Fig. 2.21. Case 5 (July 22, 2020, at 06:00 KST). Ground truth images (top),... 50
Fig. 2.22. Case 6 (June 12, 2020, at 19:00 KST). Ground truth images (top),... 51
Fig. 2.23. Average CSI scores of the model proposed in 2024 from May to... 52
Fig. 2.24. Best case 1 (July 03, 2020, at 04:00 KST). Ground truth images (top)... 52
Fig. 2.25. Best case 2 (June 15, 2020, at 06:00 KST). Ground truth images (top)... 53
Fig. 2.26. Worst case 1 (May 20, 2020, at 13:00 KST) Ground truth images... 53
Fig. 2.27. Worst case 2 (August 15, 2020, at 01:00 KST). Ground truth images... 54
Fig. 2.28. Visualization results of the model's predictions based on input data... 55
Fig. 2.29. Visualization results of the model's predictions based on input data... 55
Fig. 2.30. Average CSI scores of the model proposed in 2024. The test data is... 56
Fig. 3.1. Experiment result from Rahimi et al., 2024 59
Fig. 3.2. Histogram of accumulated precipitation and raw... 60
Fig. 3.3 Example of radar map reconstruction with 3d VQGAN at 2020.06.13.... 62
Fig. 3.4 Example of radar map reconstruction with 3d VQGAN at 2023.07.15.... 62
Fig. 3.5. Memory consumption comparison of different... 63
Fig. 3.6. Sampling distribution of video lengths with different training steps 64
Fig. 3.7. Example of droppath 65
Fig. 3.8. Comparison of different context lengths at August 14, 2020, at 10:00 KST 67
Fig. 3.9. Used channels for the geological information 68
Fig. 3.10. Comparison of SAL plots 70
Fig. 3.11. Distribution of CSI scores on different precipitation cases over... 72
Fig. 3.12. Distribution of CSI scores on general cases and selected major... 72
Fig. 3.13. Examples of precipitation cases with high CSI scores 73
Fig. 3.14. Examples of precipitation cases with low CSI scores 74
Fig. 3.15. Example of September 21, 2024, at 16:00 KST (C1 case) 75
Fig. 3.16. Example of August 5, 2024, at 21:00 KST. (C2 case) 76
Fig. 3.17. Example of May 26, 2024, at 15:00 KST (C3 case) 76
Fig. 3.18. Example of July 07, 2024, at 06:00 KST (C5 case) 77
Fig. 4.1. Two types of hierarchical clustering and flowchart 81
Fig. 4.2. Recommendation pipeline overview, consisting of three main... 82
Fig. 4.3. Clustering results with 2-9 groups developed this year. Regions... 85
Fig. 4.4. Rainfall correlation distributions of station pairs, shown... 86
Fig. 4.5. Monthly recommendation for the unit cluster case without... 94
Fig. 4.6. Monthly recommendation for the unit cluster case with probabilistic... 94
Fig. 4.7. Seasonal recommendation for the 4 clusters without probabilistic... 95
Fig. 4.8. Seasonal recommendation for the 4 clusters with probabilistic output.... 96
Fig. 4.9. Seasonal recommendation for 4 clusters with probabilistic output.... 97
Fig 5.1. (Up) Overall architecture of Fuxi-DA Model. (Down) Comparison of... 100
Fig. 5.2. Overview of probabilistic precipitation forecast AlphaRain model 101
Fig. 5.3. Overview of AlphaRain architecture 102
Fig. 5.4. Comparison of CSI scores between GDAPS-KIM NWP model and... 109
Fig. 5.5. Comparison of CSI scores between GDAPS-UM NWP model and.... 109
Fig. 5.6. Comparison of CSI scores between ECMWF-IFS NWP model and... 110
Fig. 5.7. Comparison of CSI scores between GDAPS-KIM NWP model and... 111
Fig. 5.8. Comparison of CSI scores between GDAPS-UM NWP model and... 111
Fig. 5.9. Comparison of CSI scores between ECMWF-IFS NWP model and... 112
Fig. 5.10. Comparison of total AlphaRain model CSI scores by monthly 112
Fig. 5.11. Comparison of CSI scores between GDAPS-KIM NWP model and... 114
Fig. 5.12. Comparison of CSI scores between GDAPS-UM NWP model and... 114
Fig. 5.13. Comparison of CSI scores between ECMWF-IFS NWP model and... 115
Fig. 5.14. Comparison of total AlphaRain model CSI scores by lead time 115
Fig. 5.15. Comparison of relatvie CSI score percentage between GDAPS-KIM,... 117
Fig. 5.16. AWS precipitation visualization of 1-hour intervals at May 3, 2024, at... 118
Fig. 5.17. AWS precipitation visualization of 3-hour intervals at May... 118
Fig. 5.18. Case analysis by precipitation category, special precipitation case at... 119
Fig. 5.19. Case analysis by precipitation category, frontal precipitation case at... 119
Fig. 5.20. Case analysis by precipitation category, topographic precipitation case... 120
Fig. 5.21. Case analysis by precipitation category, cyclonic precipitation case at... 121
Fig. 5.22. Overview of train/evaluate and predict code pipeline seperation 122
Fig. 5.23. An example of analyze automation code 124
Fig. 5.24. An example of real-time prediction visualization at origin time October... 126

※ 출처: 상단의 서지정보에서 확인
※ 원저작물에 적용된 공공누리 유형: 제2유형
| 등록번호 | 청구기호 | 권별정보 | 자료실 | 이용여부 |
|---|---|---|---|---|
| 0003178395 | 551.6477 -25-2 | v.4 | 서울관 인문자연과학자료실(314호) | 이용가능 |
| 0003178396 | 551.6477 -25-2 | v.4 | 서울관 인문자연과학자료실(314호) | 이용가능 |
*표시는 필수 입력사항입니다.
| 전화번호 |
|---|
| 기사명 | 저자명 | 페이지 | 원문 | 기사목차 |
|---|
| 번호 | 발행일자 | 권호명 | 제본정보 | 자료실 | 원문 | 신청 페이지 |
|---|
도서위치안내: 인문자연과학자료실(314호) / 서가번호: 33

우편복사 목록담기를 완료하였습니다.
*표시는 필수 입력사항입니다.
저장 되었습니다.
