대표어
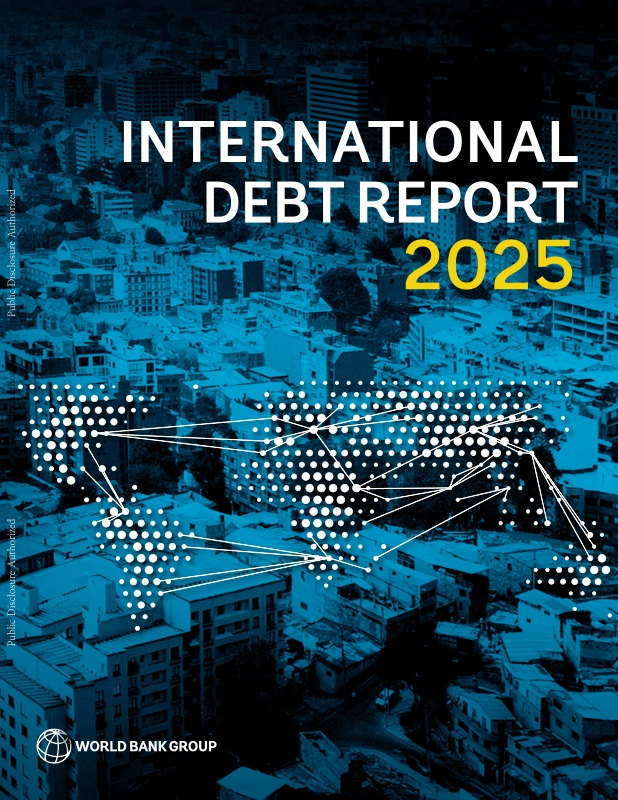
 https://documents.worldbank.org/en/publication/documents-reports/documentdetail/099122225162037208
권호기사보기
| 기사명 | 저자명 | 페이지 | 원문 | 기사목차 |
|---|
결과 내 검색
동의어 포함
Title page 1
Contents 6
Foreword 11
Acknowledgments 14
Key Takeaways 15
Abbreviations 18
PART 1. Overview 20
1. Analysis of External Debt Stock and Debt Flows as of End-2024 21
Trends in External Debt, 2014-24 21
Trends in Domestic Debt, 2014-24 27
Debt Servicing Burdens of LMICs, 2014-24 33
Trends in External Debt Flows, 2014-24 38
Trends in Net Transfers on External Debt, 2014-24 42
Key Debt Indicators, 2014-24 44
Trends in External Debt of IDA-Eligible Countries, 2014-24 49
Regional Perspectives 56
Debt Restructuring, 2024 74
2. Debt Dynamics: Policy Implications and Future Outlook 81
Debt Dynamics: Policy Implications 81
Current Debt-Growth Dynamics 81
Growth Outlook in Low- and Middle-Income Countries 84
Domestic Debt in Low-Income Countries: Recent Developments 98
High Debt, High Fragility: Interlinked Risks to Development 103
3. Advancing Debt Transparency 112
Introduction 112
Borrower Countries 113
Progress in Direct Public Debt Disclosure 113
Policy Reforms and Institutionalization 114
Reporting to the World Bank Debtor Reporting System 115
Reconciling Borrower and Creditor Data 116
Measuring Progress: Data Revisions and Transparency Outcomes 120
Improved Debt Management Capacity, Standards, and Methodology 124
Next Steps: Institutionalizing Debt Transparency Gains 125
Notes 126
References 127
PART 2. Aggregate and Country Tables 129
ALL LOW- AND MIDDLE-INCOME COUNTRIES 130
EAST ASIA AND PACIFIC 131
EUROPE AND CENTRAL ASIA 132
LATIN AMERICA AND THE CARIBBEAN 133
MIDDLE EAST, NORTH AFRICA, AFGHANISTAN, AND PAKISTAN 134
SOUTH ASIA 135
SUB-SAHARAN AFRICA 136
AFGHANISTAN 137
ALBANIA 138
ALGERIA 139
ANGOLA 140
ARGENTINA 141
ARMENIA 142
AZERBAIJAN 143
BANGLADESH 144
BELARUS 145
BELIZE 146
BENIN 147
BHUTAN 148
BOLIVIA 149
BOSNIA AND HERZEGOVINA 150
BOTSWANA 151
BRAZIL 152
BURKINA FASO 153
BURUNDI 154
CABO VERDE 155
CAMBODIA 156
CAMEROON 157
CENTRAL AFRICAN REPUBLIC 158
CHAD 159
CHINA 160
COLOMBIA 161
COMOROS 162
CONGO, DEMOCRATIC REPUBLIC OF 163
CONGO, REPUBLIC OF 164
CÔTE D'IVOIRE 165
DJIBOUTI 166
DOMINICA 167
DOMINICAN REPUBLIC 168
ECUADOR 169
EGYPT, ARAB REPUBLIC OF 170
EL SALVADOR 171
EQUATORIAL GUINEA 172
ERITREA 173
ESWATINI 174
ETHIOPIA 175
FIJI 176
GABON 177
GAMBIA, THE 178
GEORGIA 179
GHANA 180
GRENADA 181
GUATEMALA 182
GUINEA 183
GUINEA-BISSAU 184
GUYANA 185
HAITI 186
HONDURAS 187
INDIA 188
INDONESIA 189
IRAN, ISLAMIC REPUBLIC OF 190
IRAQ 191
JAMAICA 192
JORDAN 193
KAZAKHSTAN 194
KENYA 195
KOSOVO 196
KYRGYZ REPUBLIC 197
LAO PEOPLE'S DEMOCRATIC REPUBLIC 198
LEBANON 199
LESOTHO 200
LIBERIA 201
MADAGASCAR 202
MALAWI 203
MALDIVES 204
MALI 205
MAURITANIA 206
MAURITIUS 207
MEXICO 208
MOLDOVA 209
MONGOLIA 210
MONTENEGRO 211
MOROCCO 212
MOZAMBIQUE 213
MYANMAR 214
NEPAL 215
NICARAGUA 216
NIGER 217
NIGERIA 218
NORTH MACEDONIA 219
PAKISTAN 220
PAPUA NEW GUINEA 221
PARAGUAY 222
PERU 223
PHILIPPINES 224
RWANDA 225
SAMOA 226
SÃO TOMÉ AND PRÍNCIPE 227
SENEGAL 228
SERBIA 229
SIERRA LEONE 230
SOLOMON ISLANDS 231
SOMALIA, FEDERAL REPUBLIC OF 232
SOUTH AFRICA 233
SRI LANKA 234
ST. LUCIA 235
ST. VINCENT AND THE GRENADINES 236
SUDAN 237
SURINAME 238
SYRIAN ARAB REPUBLIC 239
TAJIKISTAN 240
TANZANIA 241
THAILAND 242
TIMOR-LESTE 243
TOGO 244
TONGA 245
TUNISIA 246
TÜRKIYE 247
TURKMENISTAN 248
UGANDA 249
UKRAINE 250
UZBEKISTAN 251
VANUATU 252
VIET NAM 253
YEMEN, REPUBLIC OF 254
ZAMBIA 255
ZIMBABWE 256
APPENDIX 257
Data Sources 258
Country Groups 260
Regional Groups 260
Income Groups 261
Glossary 262
Tables 10
Table 1.1. External Debt Stock of Low- and Middle-Income Countries, 2014-24 21
Table 1.2. Net Debt Inflows to IDA-Eligible Countries, 2014-24 51
Table 1.3. External Debt Stock and Net Financial Flows and Transfers, East Asia and Pacific, 2014-24 56
Table 1.4. External Debt Stock and Net Financial Flows and Transfers, Europe and Central Asia, 2014-24 59
Table 1.5. External Debt Stock and Net Financial Flows and Transfers, Latin America and the Caribbean, 2014-24 62
Table 1.6. External Debt Stock and Net Financial Flows and Transfers, Middle East, North Africa, Afghanistan, and Pakistan, 2014-24 65
Table 1.7. External Debt Stock and Net Financial Flows and Transfers, South Asia, 2014-24 68
Table 1.8. External Debt Stock and Net Financial Flows and Transfers, Sub-Saharan Africa, 2014-24 71
Figures 8
Figure 1.1. Creditor Composition of Long-Term External Debt Stock in Low- and Middle-Income Countries, 1970-2024 23
Figure 1.2. Change in Domestic and External Government Debt, Selected Low- and Middle-Income Countries, 2023-24 29
Figure 1.3. Change in External vs. Domestic Government Debt, Selected Low- and Middle-Income Countries, 2023-24 32
Figure 1.4. Low- and Middle-Income Countries' Interest Payments on External Debt, by Debtor Type, 2014-24 34
Figure 1.5. Average Terms on New External Debt Commitments for Low- and Middle-Income Countries, by Creditor Type, 2014-24 35
Figure 1.6. Interest Payments on Public and Publicly Guaranteed Debt for Low- and Middle-Income Countries, by Type of Interest Rate, 2014-24 36
Figure 1.7. Interest Payments on Public and Publicly Guaranteed Debt of Low- and Middle-Income Countries, by Region and Creditor Type, 2022-24 37
Figure 1.8. Net Debt Inflows, by Maturity, Low- and Middle-Income Countries, 2014-24 38
Figure 1.9. Long-Term External Debt Flows to Low- and Middle-Income Countries, by Borrower Type, 2022-24 39
Figure 1.10. Bond Flows to Low- and Middle-Income Countries, by Borrower Type, 2023-24 40
Figure 1.11. Long-Term Net Transfers on External Debt in Low-and Middle-Income Countries, by Debtor Type, 2014-24 42
Figure 1.12. Long-Term Net Transfers on Public and Publicly Guaranteed External Debt in Low- and Middle-Income Countries, by Creditor Type, 2014-24 43
Figure 1.13. External Debt-to-GNI and Interest Payments-to-GNI Ratios for Low- and Middle-Income Countries and IDA-Eligible Countries, 2014-24 45
Figure 1.14. Creditor Composition of IDA-Eligible Countries' Long-Term Public and Publicly Guaranteed External Debt during Crises, 2014-24 50
Figure 1.15. Net Flows to IDA-Eligible Countries, by Region and Creditor Type, 2024 52
Figure 1.16. Average Terms on New External Debt Commitments for IDA-Eligible Countries, by Creditor Type, 2014-24 53
Figure 1.17. Net Transfers on Public and Publicly Guaranteed Debt in IDA-Eligible Countries, by Creditor Type, 2022-24 55
Figure 1.18. Net Debt Flows for East Asia and Pacific Countries (Excluding China), by Creditor Type, 2022-24 57
Figure 1.19. Net Long-Term Debt Inflows from Private Creditors to Select East Asia and Pacific Countries, 2023 and 2024 58
Figure 1.20. Net Debt Flows to Europe and Central Asia, by Creditor Type, 2014-24 60
Figure 1.21. Bond Flows to Europe and Central Asia, by Borrower Type, 2023 and 2024 61
Figure 1.22. Net Debt Flows to Latin America and the Caribbean, by Creditor Type, 2014-24 63
Figure 1.23. Bond Flows to Latin America and the Caribbean, by Borrower Type, 2023 and 2024 64
Figure 1.24. Net Debt Flows to the Middle East, North Africa, Afghanistan, and Pakistan, by Creditor Type, 2014-24 67
Figure 1.25. Bond Flows to the Middle East, North Africa, Afghanistan, and Pakistan, by Borrower Type, 2023 and 2024 67
Figure 1.26. Net Inflows of Long-Term Public and Publicly Guaranteed and Private Nonguaranteed External Debt to South Asia, by Borrower Type, 2022-24 69
Figure 1.27. External Debt Stocks as a Share of Exports of Goods, Services, and Primary Income and GNI, South Asia, 2023 and 2024 70
Figure 1.28. Net Debt Flows to Sub-Saharan Africa (Excluding South Africa), by Creditor Type, 2022-24 72
Figure 1.29. Net Transfers to Sub-Saharan Africa (Excluding South Africa), by Borrower Type, 2014-24 73
Figure 2.1. GDP Growth and Year-on-Year Percentage Growth in External Debt Stock, by Region, 2015-24 82
Figure 2.2. Correlation between GDP Growth and External Debt Stock Year-on-Year Percentage Growth, by Region, 2015-19 vs. 2020-24 83
Figure 2.3. Growth in Low- and Middle-Income Countries, 2022-27 85
Figure 2.4. Inflation in Low- and Middle-Income Countries, 2024-27 87
Figure 2.5. Policy Rates in Low- and Middle-Income Countries, 2022-25 88
Figure 2.6. Current Account Balance and Foreign Direct Investment, Low- and Middle-Income Countries, 2000-24 90
Figure 2.7. Government Revenues as a Share of GDP, 2010s and 2020s 93
Figure 2.8. Economic Policy Uncertainty, 2000-09, 2010-19, and 2020-25 93
Figure 2.9. Share of Domestic Public Debt in Low-Income Country Debt Sustainability Framework Countries, 2014 and 2024 99
Figure 2.10. Composition of Public Domestic Debt in Low-Income Country Debt Sustainability Framework Countries, 2024 100
Figure 2.11. Distribution of Real Interest Rate on Domestic Debt, 2024 101
Figure 2.12. Low-Income Debt Sustainability Framework Countries with Claims Exceeding 25 Percent of Balance Sheet, by Type of Investor, 2014 vs. 2023 103
Figure 2.13. Food and Nutrition Security, by Country Debt Level 106
Figure 2.14. Risk and Vulnerability, by Country Debt Level 108
Figure 2.15. Institutional Capacity, by Country Debt Level 110
Figure 3.1. Public Debt Disclosures by IDA-Eligible Countries, Access and Coverage, 2020 and 2024 114
Figure 3.2. Share of Countries Improving or Backsliding on Debt Reporting Heat Map, by Number of Debt Transparency PPAs Implemented, 2021-24 115
Figure 3.3. Debtor Reporting System Reporting Timetable, 2019-24 116
Figure 3.4. Debt Stock of Newly Matched Loans between End-2021 and End-2023, G-7/Paris Club Data-Sharing Exercise 118
Figure 3.5. Asymmetries between Creditor and Borrower Claims on Debt Outstanding Position at End-2023 119
Figure 3.6. Ex Post Revision of Commitments, Low- and Middle-Income Countries (Excluding China), 2014-24 122
Boxes 8
Box 1.1. External Debt Data: Concepts, Sources, and Coverage 24
Box 1.2. World Bank Income and Lending Classifications Used in International Debt Report 2025 26
Box 1.3. The World Bank's Role in Developing Domestic Financial Markets 30
Box 1.4. Debt-to-GDP and Debt-to-GNI Ratios, and Accounts Rebasing 45
Box 1.5. Côte d'Ivoire: World Bank-Supported Debt-for-Development Swap 79
Box 2.1. Trade Volatility and Debt Sustainability in Low-Income Countries 94
Box 3.1. Guinea-Bissau: A Commitment to Debt Transparency 120
Box Figures 8
Figure B1.2.1. Number of Low- and Middle-Income Countries Covered in International Debt Report 2025, by FY2026 Income and Lending Groups 27
Figure B1.4.1. Variation in GDP levels 48
Figure B2.1.1. Export Earnings and External Debt Stock, Low-Income Countries, 2005-24 94
Figure B2.1.2. Ratio of Debt Service to Exports, 2014 vs. 2024 95
Figure B2.1.3. Five-Year Rolling Volatility of Exports Earnings, 2009-24 96
Figure B2.1.4. Export Volatility in Low-Income Countries, by Debt Risk Category, 2014-24 97
Figure B3.1.1. External Debt Stock: Comparison of DRS and Debt Bulletins, 2023 and 2024 121

*표시는 필수 입력사항입니다.
| 전화번호 |
|---|
| 기사명 | 저자명 | 페이지 | 원문 | 기사목차 |
|---|
| 번호 | 발행일자 | 권호명 | 제본정보 | 자료실 | 원문 | 신청 페이지 |
|---|
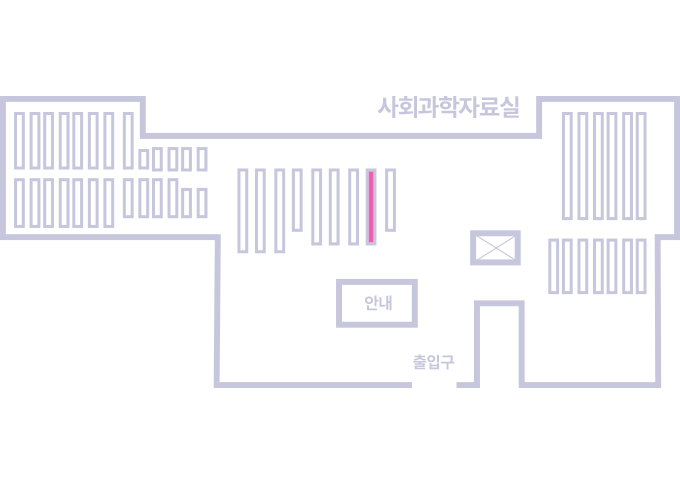
도서위치안내: / 서가번호:
우편복사 목록담기를 완료하였습니다.
*표시는 필수 입력사항입니다.
저장 되었습니다.