
 대표어
대표어
 https://www.iza.org/publications/dp/16695/automation-and-gender-implications-for-occupational-segregation-and-the-gender-skill-gap
권호기사보기
| 기사명 | 저자명 | 페이지 | 원문 | 기사목차 |
|---|
결과 내 검색
동의어 포함
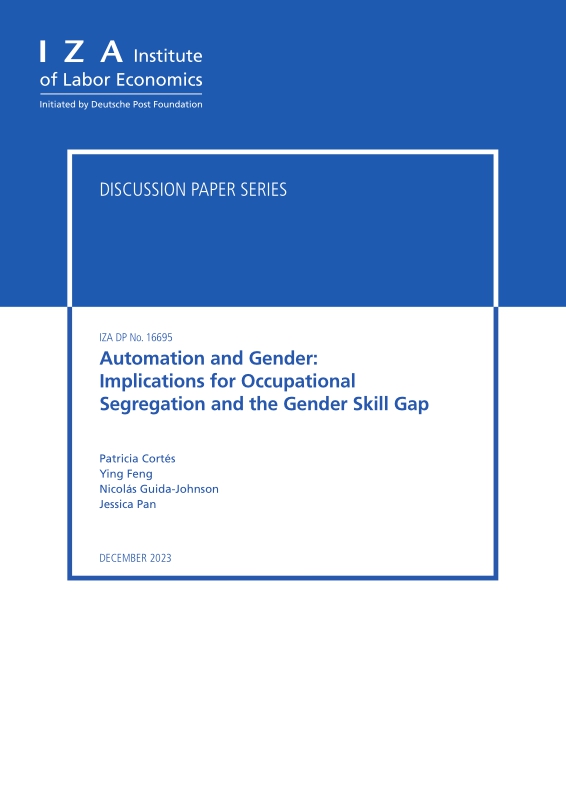
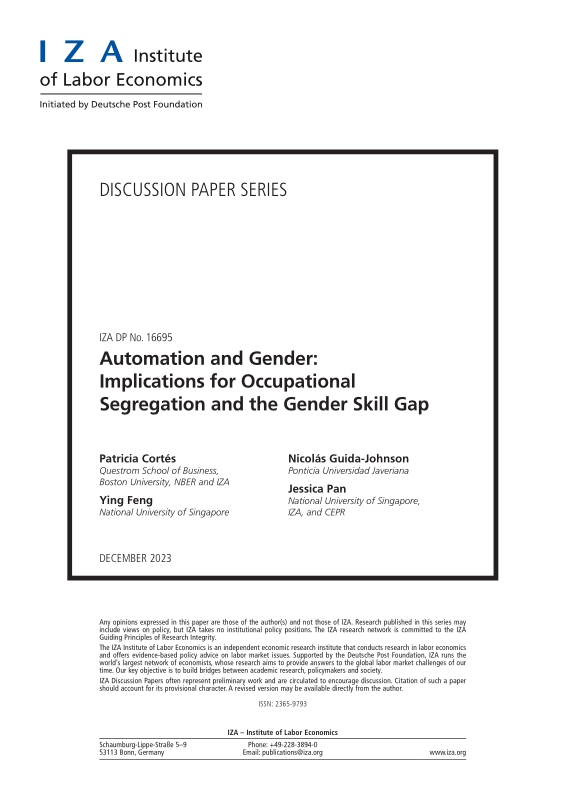
Title page
Contents
Abstract 3
1. Introduction 4
2. Automation and Gender: Some Descriptive Patterns 7
2.1. Automation Risk Measure 8
2.2. Gender Gaps in Automation Risk 8
3. Cross-Commuting Zone Analysis 11
3.1. Data 11
3.2. Empirical Strategy 12
3.3. Correlational Evidence Across Commuting Zones 13
3.4. Instrumental Variables Approach 15
3.5. Effects on Skill Investments 17
3.6. Between vs. Within Cohorts Effects 18
3.7. Alternative Hypotheses: Trade Shocks, Offshoring Potential, and Gender Norms 19
4. Model 20
4.1. Analytical Predictions 21
4.2. Evidence for Model Assumptions and Empirical Implications 23
5. Conclusion 26
References 28
Appendix 45
A. Data Appendix 45
B. Model Appendix - Proofs 46
C. Appendix Tables and Figures 49
Figure 1. Trends in Occupational Segregation and the Gender College Gap 33
Figure 2. Task Inputs, Changes in Occupational Shares, and Occupational Segregation 34
Figure 3. Change in Employment and RTI by Gender 35
Figure 4. Change in Aggregate Employment Share from 1980 to 2017 Across Broad Occupation Groups by Gender 36
Figure 5. Change in Employment by Female Share Percentile and CZ group 37
Figure 6. Change in Employment Share by CZ and Gender 38
*표시는 필수 입력사항입니다.
| 전화번호 |
|---|
| 기사명 | 저자명 | 페이지 | 원문 | 기사목차 |
|---|
| 번호 | 발행일자 | 권호명 | 제본정보 | 자료실 | 원문 | 신청 페이지 |
|---|
도서위치안내: / 서가번호:

우편복사 목록담기를 완료하였습니다.
*표시는 필수 입력사항입니다.
저장 되었습니다.
