 https://www.bruegel.org/working-paper/unpacking-chinas-industrial-policy-and-its-implications-europe


권호기사보기
| 기사명 | 저자명 | 페이지 | 원문 | 기사목차 |
|---|
| 대표형(전거형, Authority) | 생물정보 | 이형(異形, Variant) | 소속 | 직위 | 직업 | 활동분야 | 주기 | 서지 | |
|---|---|---|---|---|---|---|---|---|---|
| 연구/단체명을 입력해주세요. | |||||||||
|
|
|
|
|
|
* 주제를 선택하시면 검색 상세로 이동합니다.
Title page
Contents
1. Objective 2
2. The economic rationale for industrial policy 2
3. How does China conduct industrial policy? 4
3.1. Industrial policy and technological upgrading 4
3.2. Made in China 2025 and the 10,000 Little Giants 5
3.3. Instruments of China's industrial policy 8
4. How successful has China's industrial policy been? 16
4.1. Most obvious achievements from China's industrial policy 17
4.2. Which sectors have done better? 18
4.3. Industrial policy for competitiveness 24
4.4. What happened to China's productivity growth? 25
5. Policy implications: takeaways for Europe 27
References 29
Appendix: Word cloud of the key industrial policy tools launched by the Chinese government 33
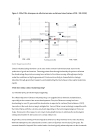
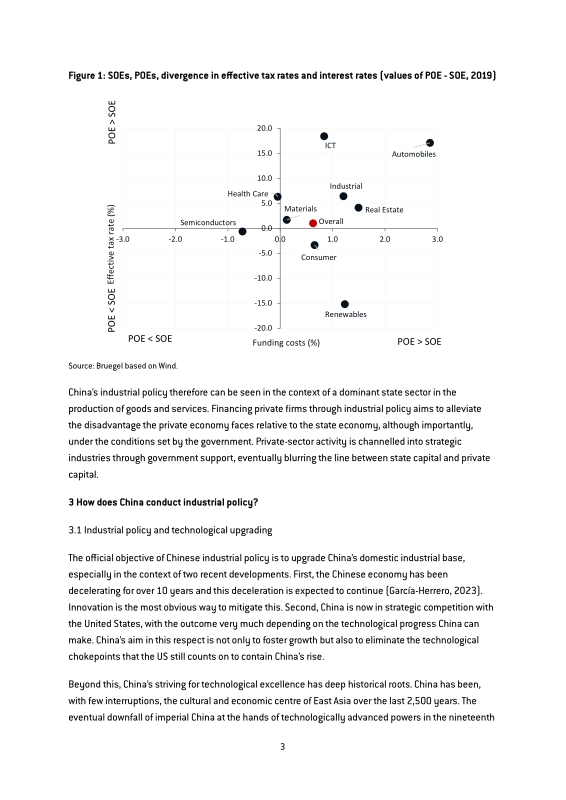
Figure 1. SOEs, POEs, divergence in effective tax rates and interest rates (values of POE - SOE, 2019) 4
Figure 2. Industry focus of listed Little Giant firms 7
Figure 3. Direct government subsidies to listed firms in China 8
Figure 4. Sectoral classification of direct subsidies in China (2015-2022) 9
Figure 5. Fossil fuel subsidies in China, by type 10
Figure 6. Number and scale of newly established Government Guidance Funds 11
Figure 7. Administrative distribution of GGFs 11
Figure 8. GGF investment across industries (2017-2019) 12
Figure 9. Top 10 CIC equity investment deals 13
Figure 10. Percentage of shares held by Central Huijin 14
Figure 11. Little Giant firms in new stock market listings 15
Figure 12. Share of Chinese patents in total newly granted patents at the USPTO 17
Figure 13. Difference in the value added in exports between China and selected countries 18
Figure 14. Share of objects launched into space, by country 19
Figure 15. Robot density in 2016 and 2022 19
Figure 16. Biotechnology, pharmaceuticals and high-performance medical devices 20
Figure 17. Global market share of rolling stock manufacturers 21
Figure 18. Global market share of shipbuilding firms 21
Figure 19. Country share of USPTO patent grants in the transportation sector 22
Figure 20. Share of Chinese exports in world exports (electrical equipment) 23
Figure 21. Share of Chinese exports in world exports (new energy and energy saving vehicles) 24
Figure 22. Total factor productivity growth, by country 25
*표시는 필수 입력사항입니다.
| *전화번호 | ※ '-' 없이 휴대폰번호를 입력하세요 |
|---|
| 기사명 | 저자명 | 페이지 | 원문 | 기사목차 |
|---|
| 번호 | 발행일자 | 권호명 | 제본정보 | 자료실 | 원문 | 신청 페이지 |
|---|
도서위치안내: / 서가번호:

우편복사 목록담기를 완료하였습니다.
*표시는 필수 입력사항입니다.
저장 되었습니다.
