 https://www.gao.gov/products/gao-25-108136
권호기사보기
| 기사명 | 저자명 | 페이지 | 원문 | 기사목차 |
|---|
| 대표형(전거형, Authority) | 생물정보 | 이형(異形, Variant) | 소속 | 직위 | 직업 | 활동분야 | 주기 | 서지 | |
|---|---|---|---|---|---|---|---|---|---|
| 연구/단체명을 입력해주세요. | |||||||||
|
|
|
|
|
|
* 주제를 선택하시면 검색 상세로 이동합니다.
Title page 1
Contents 1
Highlights 2
Background 5
Shipbuilding Practices 5
Navy Shipbuilding Industrial Base 5
Leading Practices in Product Development 6
Navy's Schedule, Cost, and Performance Shortfalls Are Long-Standing 9
Navy Budget and Acquisition Processes Stifle Innovative Technologies 13
Navy Faces Rapid Change from Warfighting Innovations 13
Budget Processes Lack Timeliness and Flexibility Needed to Rapidly Deliver Innovation to the Fleet 14
Acquisition Processes Do Not Enable Pace Needed for New Ship Deliveries 17
Industrial Base Limitations Impede Navy's Ability to Improve Shipbuilding Outcomes 18
Infrastructure and Workforce Limitations Weigh on Shipbuilding Outcomes 19
Navy Shipbuilding Plans and Contracting Strategies Have Not Driven Private Industrial Base Investments 19
Benefits Are Uncertain from DOD's Shipbuilding Industrial Base Investments 21
Navy Efforts to Improve Industrial Base Challenges Are Hindered by Lack of Long-Term Management Strategy 22
A New Approach Is Needed to Meet Modern Challenges 23
GAO Contact and Staff Acknowledgments 28
Figures 5
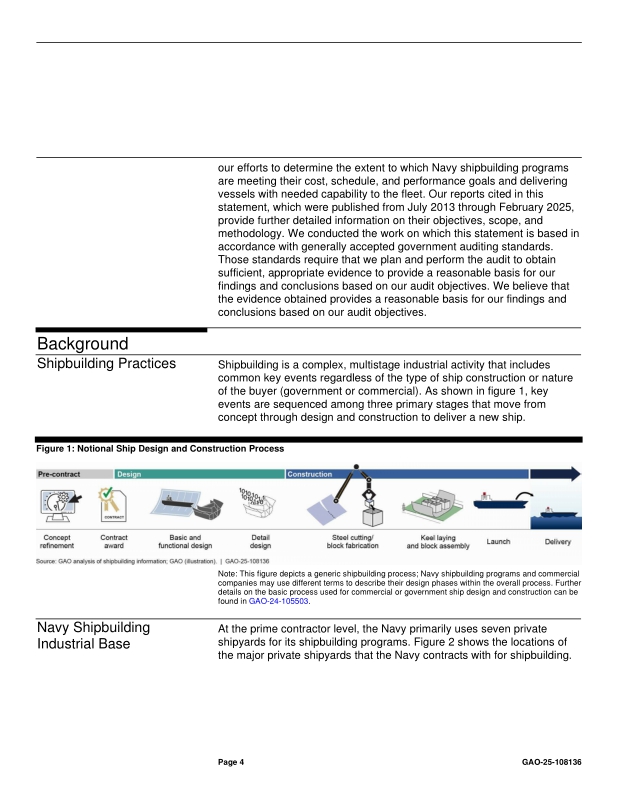
Figure 1. Notional Ship Design and Construction Process 5
Figure 2. Locations of Major Shipyards That Build Navy Ships 6
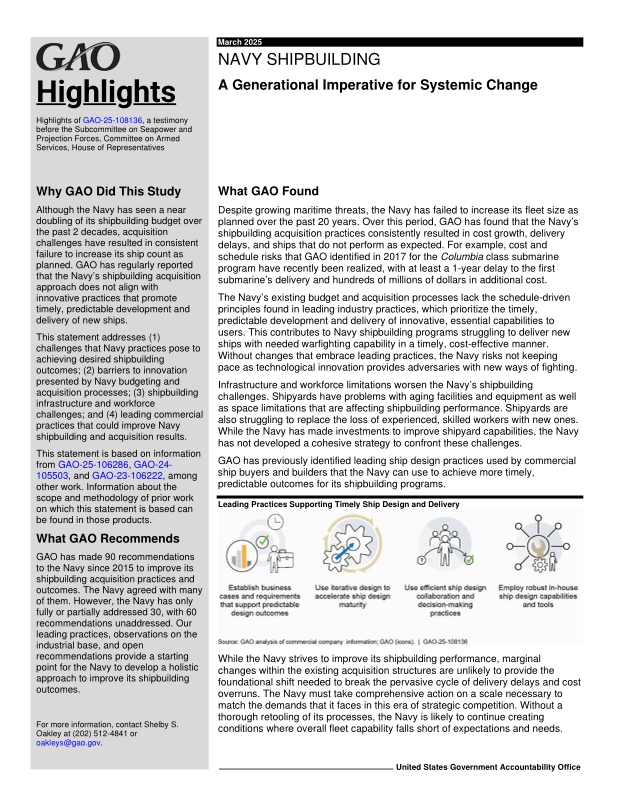
Figure 3. Key Principles Used by Commercial Companies to Enable Successful Product Development 7
Figure 4. Iterative Cycles of Design, Validation, and Production Used for Product Development 8
Figure 5. Schedule Delays for Navy Ships Under Construction as of September 2024 12
Figure 6. Key Infrastructure and Workforce Challenges Facing the Shipbuilding Industrial Base 19
Figure 7. Greatest and Least Number of Ships Planned for Procurement in Navy Annual Shipbuilding Plans, Fiscal Years 2019-2025 20
Figure 8. Navy and OSD Investments and Budget Requests for the Shipbuilding Industrial Base, Fiscal Years 2014-2028 21
Figure 9. Comparison of Design and Construction Cycle Times for Selected Commercial Ships and Navy Ships Provided to the Fleet Since 2007 24
Figure 10. GAO Comparison of Leading Ship Design Practices for Commercial Companies and U.S. Navy 25
*표시는 필수 입력사항입니다.
| 전화번호 |
|---|
| 기사명 | 저자명 | 페이지 | 원문 | 기사목차 |
|---|
| 번호 | 발행일자 | 권호명 | 제본정보 | 자료실 | 원문 | 신청 페이지 |
|---|
도서위치안내: / 서가번호:

우편복사 목록담기를 완료하였습니다.
*표시는 필수 입력사항입니다.
저장 되었습니다.
