 https://www.wto.org/english/res_e/publications_e/trade_outlook25_e.htm

권호기사보기
| 기사명 | 저자명 | 페이지 | 원문 | 기사목차 |
|---|
| 대표형(전거형, Authority) | 생물정보 | 이형(異形, Variant) | 소속 | 직위 | 직업 | 활동분야 | 주기 | 서지 | |
|---|---|---|---|---|---|---|---|---|---|
| 연구/단체명을 입력해주세요. | |||||||||
|
|
|
|
|
|
* 주제를 선택하시면 검색 상세로 이동합니다.
Title page 1
Contents 3
Acknowledgements 2
Executive summary 4
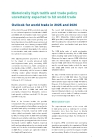
Outlook for world trade in 2025 and 2026 5
Merchandise trade 5
Commercial services trade 11
Trade-related indicators 18
Drivers of trade and output 19
Fragmentation of world trade 22
Analytical Chapter: Modelling trade policy uncertainty and changes in tariffs 24
Bibliography 38
Tables 8
Table 1. Merchandise trade volume and GDP growth, 2023-2026 8
Table 2. Commercial services trade volume growth, 2023-2026 11
Table 3. Projected change in growth rate of trade and GDP for different regions 27
Boxes 13
Box 1. Measuring global services trade in volume terms 13
Box 2. Economic effects of tariffs 21
Charts 6
Chart 1. World merchandise trade volume and GDP growth, 2019-2026 6
Chart 2. Contributions to world merchandise trade volume growth by region, 2023-2026 7
Chart 3. Merchandise export and import volume indices by region, 2019Q1-2024Q4 9
Chart 4. Merchandise trade growth by product 10
Chart 5. Merchandise trade of LDCs, 2020‑2024 10
Chart 6. Commercial services trade volume, 2015-2027 12
Chart 7. Commercial services trade volume adjusted forecast, 2015-2026 13
Chart 8a. Commercial services trade growth in value and volume terms, 2019-2024 14
Chart 8b. Computer services trade growth in value and volume terms, 2019-2024 14
Chart 9. Commercial services trade growth by sector, 2023-2024 15
Chart 10. Commercial services trade growth by region and main sector, 2024 16
Chart 11. Global container throughput index, January 2019-February 2025 18
Chart 12. New export orders from purchasing managers indices (PMIs) 19
Chart 13. Trade within and between hypothetical geopolitical blocs (left) and difference of between-bloc and within-bloc trade (right) 23
Chart 14. WTO members' average tariff, 2022 25
Chart 15. Trade-weighted average US tariff increase and contribution of different policies 28
Chart 16. Projected change in growth rate of world trade and GDP 29
Chart 17. Projected changes in real GDP as a function of the share of exports going to the United States 30
Chart 18. Trade diversion impacts: projected per cent changes in merchandise exports to the United States and imports from China and projected point changes... 31
Appendix Tables 33
Appendix Table 1. Leading exporters and importers in world merchandise trade, 2024 33
Appendix Table 2. Leading exporters and importers in world merchandise trade excluding intra-EU trade, 2024 34
Appendix Table 3. Leading exporters and importers of commercial services, 2024 35
Appendix Table 4. Leading exporters and importers of commercial services excluding intra-EU trade, 2024 36
Appendix Table 5. Leading exporters and importers of digitally delivered services, 2024 37
*표시는 필수 입력사항입니다.
| *전화번호 | ※ '-' 없이 휴대폰번호를 입력하세요 |
|---|
| 기사명 | 저자명 | 페이지 | 원문 | 기사목차 |
|---|
| 번호 | 발행일자 | 권호명 | 제본정보 | 자료실 | 원문 | 신청 페이지 |
|---|
도서위치안내: / 서가번호:

우편복사 목록담기를 완료하였습니다.
*표시는 필수 입력사항입니다.
저장 되었습니다.
