 https://op.europa.eu/en/publication-detail/-/publication/afa29f01-41bd-11f0-b9f2-01aa75ed71a1/language-en?WT.mc_id=Selectedpublications&WT.ria_c=41957&WT.ria_f=6415&WT.ria_ev=search
권호기사보기
| 기사명 | 저자명 | 페이지 | 원문 | 기사목차 |
|---|
| 대표형(전거형, Authority) | 생물정보 | 이형(異形, Variant) | 소속 | 직위 | 직업 | 활동분야 | 주기 | 서지 | |
|---|---|---|---|---|---|---|---|---|---|
| 연구/단체명을 입력해주세요. | |||||||||
|
|
|
|
|
|
* 주제를 선택하시면 검색 상세로 이동합니다.
Title page 1
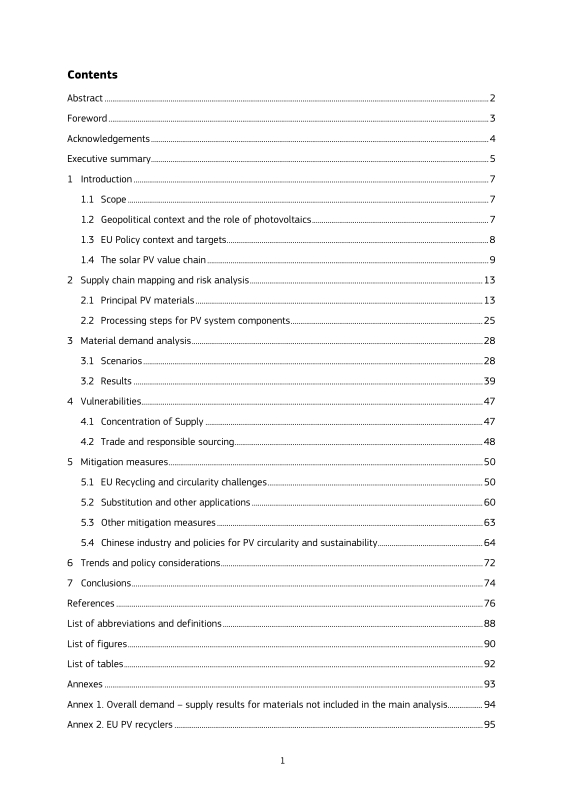
Contents 3
Abstract 4
Foreword 5
Acknowledgements 6
Executive summary 7
1. Introduction 9
1.1. Scope 9
1.2. Geopolitical context and the role of photovoltaics 9
1.3. EU Policy context and targets 10
1.4. The solar PV value chain 11
1.4.1. Overview 11
1.4.2. Solar PV technologies 12
1.4.3. Solar PV applications 13
2. Supply chain mapping and risk analysis 15
2.1. Principal PV materials 15
2.1.1. Silicon 16
2.1.2. Silver 18
2.1.3. Copper 20
2.1.4. Aluminium 22
2.1.5. Indium 24
2.1.6. Other Critical Materials 26
2.2. Processing steps for PV system components 27
2.2.1. Crystalline technology 27
2.2.2. Perovskite technology 28
2.2.3. Inverters 28
2.2.4. Other components 28
3. Material demand analysis 30
3.1. Scenarios 30
3.1.1. Deployment capacities 30
3.1.2. Technology mix 32
3.1.3. Material usage 35
3.2. Results 41
3.2.1. Baseline (BASE) technology scenario 42
3.2.2. Innovation (INNO) technology scenario 44
3.2.3. Overall Material Demand-Supply Assessment 46
4. Vulnerabilities 49
4.1. Concentration of Supply 49
4.2. Trade and responsible sourcing 50
5. Mitigation measures 52
5.1. EU Recycling and circularity challenges 52
5.1.1. Scope 52
5.1.2. Challenges 54
5.1.3. Stakeholder survey and SWOT Analysis 56
5.1.4. Projected volumes of recycled materials 58
5.1.5. Mapping of recyclers and recycling capacities 60
5.2. Substitution and other applications 62
5.3. Other mitigation measures 65
5.4. Chinese industry and policies for PV circularity and sustainability 66
5.4.1. A brief history of solar PV sector development in China 66
5.4.2. Chinese policies concerning solar PV circularity 67
5.4.3. Chinese solar PV companies' circular economy initiatives 71
5.4.4. EU-China competitiveness 72
6. Trends and policy considerations 74
7. Conclusions 76
References 78
List of abbreviations and definitions 90
Annex 1. Overall demand - supply results for materials not included in the main analysis 96
Annex 2. EU PV recyclers 97
Tables 94
Table 1. Efficiencies of the 5 silicon-based PV modules in 2023 and 2050 36
Table 2. Annual materials demand in 2022, 2030 and 2050 for the BASE and INNO scenarios for the EU 41
Table 3. Annual materials demand in 2022, 2030 and 2050 for the BASE and INNO scenarios for the world 41
Table 4. Ratio of 2022, 2030 and 2050 world annual material demand to 2020 global material production. Values above the postulated 20% sustainability... 46
Table 5. EU PV manufacturing scenario: ratio of 2030 and 2050 EU annual material demand assuming EU production satisfies 40% of demand to 2020 EU... 47
Table 6. PV module waste (in tonnes) collected under WEEE in Europe in 2018 54
Table 7. PV module material breakdown and potential recycling yield 56
Table 8. SWOT Analysis of Photovoltaic (PV) Recycling in the European Union 58
Table 9. Overview of Photovoltaic (PV) Capacity, Waste Collection, Recycling Capacity, and Projected Waste in the EU and Selected Non-EU Countries (2023-2050) 61
Table 10. Overview of CRMs used in solar PV and possible substitutes, where available 64
Table 11. The key selected policies concerning circular economy in solar PV sector 67
Table 12. Summary of demand for other materials (not CRMs or not analysed in the body of the report) in 2022, 2030 and 2050, for the BASE and INNO... 96
Table 13. Summary of other materials annual demand in 2022, 2030 and 2050 for the BASE and INNO scenarios for the world 96
Figures 92
Figure 1. Solar PV value chain tiers and a (non-exhaustive) list of the materials and/or components used in each 11
Figure 2. Solar PV module structure 12
Figure 3. Critical and strategic raw materials used in solar PV 15
Figure 4. Raw material factsheet: MGS/Silicon 17
Figure 5. Raw material factsheet: Silver 19
Figure 6. Raw material factsheet: Copper 21
Figure 7. Raw material factsheet: Aluminium 23
Figure 8. Raw material factsheet: Indium 25
Figure 9. Distribution of capabilities for extraction, processing and manufacturing of solar PV materials and components for crystalline silicon (c-Si) and perovskite... 29
Figure 10. PV install capacity (GWac) in the regions considered 31
Figure 11. Solar PV annual deployed capacity (GWp) in the EU and globally, 2023-2050 31
Figure 12. EU PV technology share evolution under (a) the BASE and (b) the INNO technology scenario 33
Figure 13. Global PV technology share evolution under (a) the BASE and (b) the INNO technology scenarios 34
Figure 14. Silicon intensity for the different PV technologies until 2050 36
Figure 15. Silver intensity for the different PV technologies until 2050 37
Figure 16. Copper intensity for the different PV technologies until 2050 39
Figure 17. Aluminium intensity for the different PV technologies until 2050 39
Figure 18. Indium intensity for the different PV technologies until 2050 40
Figure 19. Gallium intensity for the different PV technologies until 2050 40
Figure 20. Material demand for PV in 2030 and 2050 for the EU according to the BASE and INNO scenarios. Material demand for PV in 2022 is presented... 42
Figure 21. Material demand for PV in 2030 and 2050 for the world according to the BASE and INNO scenarios. Material demand for PV in 2022 is presented along... 44
Figure 22. Ratio of the materials content (by weight) of PV modules decommissioned in 2049 to that of those installed in 2050 48
Figure 23. PV module waste (in tonnes) collected in the EU (data reported by 20 countries up to now) 52
Figure 24. PV module waste (in tonnes) collected in the EU Member States up to 2021 53
Figure 25. Percentage of PV panels waste recycled or prepared for reuse in 2020 and 2021 54
Figure 26. Cumulative PV WEEE mass for China, Germany, EU and the US in a regular-loss scenario 59
Figure 27. Progress in PV tandem devices efficiencies 63
Figure 28. Schematic development of the solar PV industry in China 67
*표시는 필수 입력사항입니다.
| 전화번호 |
|---|
| 기사명 | 저자명 | 페이지 | 원문 | 기사목차 |
|---|
| 번호 | 발행일자 | 권호명 | 제본정보 | 자료실 | 원문 | 신청 페이지 |
|---|
도서위치안내: / 서가번호:

우편복사 목록담기를 완료하였습니다.
*표시는 필수 입력사항입니다.
저장 되었습니다.
