
 대표어
대표어
 https://www.fraserinstitute.org/studies/women-economic-freedom-and-prosperity-around-world
권호기사보기
| 기사명 | 저자명 | 페이지 | 원문 | 기사목차 |
|---|
결과 내 검색
동의어 포함
Title page 1
Contents 5
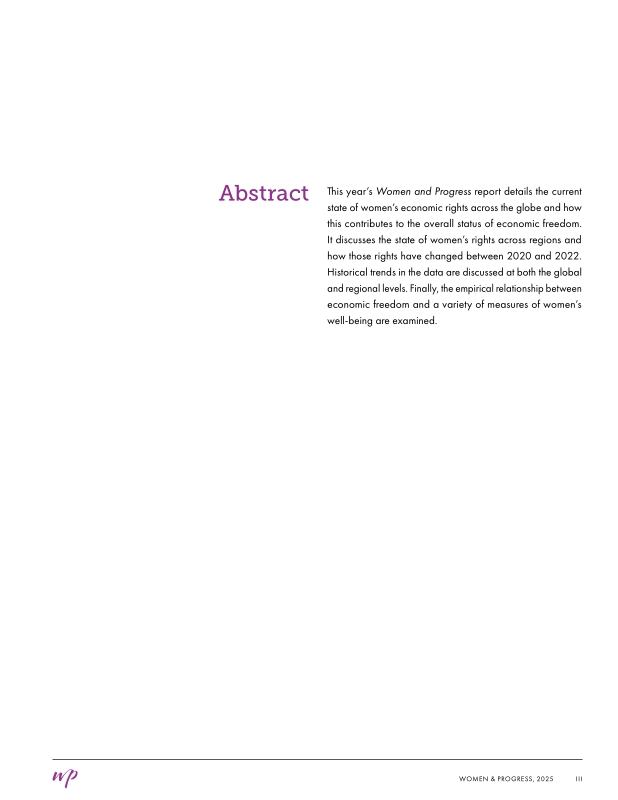
Abstract 3
1.0. Introduction 7
2.0. The Gender Disparity Index and Economic Freedom of the World 10
3.0. Gender Disparity Across Global Regions, 1970-2022 16
4.0. Economic Freedom and Measures of Women's Well-Being 18
5.0. Concluding Remarks 29
References 30
Appendix 31
Tables 11
TABLE 2.1. Countries with No Gender Disparity under the Formal Law, 2022 11
TABLE 2.2. Countries with Gender Disparity Scores Below 0.8, 2022 11
TABLE 2.3. Countries with Gender Disparity Index Scores Below 1.0 but Above 0.8, 2022 12
TABLE 2.4. Countries with the Largest Percentage Decrease in EFW Score After Adjustment, 2022 12
TABLE 2.5. Countries with a Decrease in Rankings Due to Gender Adjustment, 2022 13
TABLE 2.6. Countries with Notable Changes in GDI Scores Between 2020 and 2022 14
Figures 13
Figure 2.1/Figure 1. Global Average GDI Score 13
Figure 3.1. Regional Average Gender Disparity Scores by Decade 17
Figure 3.2. Change in Gender Disparity Scores, 1970-2020s 17
Figure 4.1. Gender Disparity Index Scores 19
Figure 4.2. Difference Between Adjusted and Unadjusted EFW Scores 19
Figure 4.3. Labor Force Participation Rates, (% of Population Ages 15-64) 19
Figure 4.4. Employment-to-Population Ratio (Ages 15+) 20
Figure 4.5. Share of Labor Force with Advanced Education (% of Working-Age Population) 20
Figure 4.6. Unemployment Rate (% of Labor Force) 21
Figure 4.7. Unemployment with Advanced Education (% of Labor Force with Advanced Education) 21
Figure 4.8. Labor Force, Female (% of Total Labor Force) 21
Figure 4.9. Account Ownership at a Financial Institution or with a Mobile Money Service Provider (% of Population Ages 15+) 22
Figure 4.10. Gross National Income per Person, by Gender 22
Figure 4.11. Life Expectancy at Birth (Years) 23
Figure 4.12. Lifetime Risk of Maternal Death (per 100,000 Women) 23
Figure 4.13. Infant Mortality Rate (Deaths per 1,000 Live Births) 23
Figure 4.14. Mortality Rate, Under 5 (Deaths per 1,000 Live Births) 24
Figure 4.15. Child Immunization Rates 24
Figure 4.16. Deaths by Communicable Diseases and Maternal, Prenatal, and Nutritional Conditions (% of Total Deaths) 24
Figure 4.17. Adolescent Fertility Rate (Births per 1,000 Women Ages 15-19) 25
Figure 4.18. Unmet Need for Contraception (% of Married Women Ages 15-49) 25
Figure 4.19. Births Attended by Skilled Health Staff (% of Total Births) 25
Figure 4.20. Prevalence of Human Trafficking, Global Organized Crime Index 26
Figure 4.21. Children Out of School (% of Primary School-Age) 26
Figure 4.22. Primary Completion Rate (% of Population 25+) 27
Figure 4.23. Completion of Lower-Secondary Education (% of Population 25+) 27
Figure 4.24. Completion of Post-Secondary Education (% of Population 25+) 27
Figure 4.25. Share of Youth Not in Education, Employment, or Training (% of Population Ages 15-24) 28
Figure 4.26. Human Capital Index (Scale 0-1) 28
Appendix Tables 31
Table A.1. List of Countries, Gender Disparity Index Scores and Rankings for 2022 31
*표시는 필수 입력사항입니다.
| 전화번호 |
|---|
| 기사명 | 저자명 | 페이지 | 원문 | 기사목차 |
|---|
| 번호 | 발행일자 | 권호명 | 제본정보 | 자료실 | 원문 | 신청 페이지 |
|---|
도서위치안내: / 서가번호:

우편복사 목록담기를 완료하였습니다.
*표시는 필수 입력사항입니다.
저장 되었습니다.
