 https://itif.org/publications/2025/11/17/us-national-power-industries-are-at-risk/

권호기사보기
| 기사명 | 저자명 | 페이지 | 원문 | 기사목차 |
|---|
| 대표형(전거형, Authority) | 생물정보 | 이형(異形, Variant) | 소속 | 직위 | 직업 | 활동분야 | 주기 | 서지 | |
|---|---|---|---|---|---|---|---|---|---|
| 연구/단체명을 입력해주세요. | |||||||||
|
|
|
|
|
|
* 주제를 선택하시면 검색 상세로 이동합니다.
Title page 1
Contents 2
KEY TAKEAWAYS 1
INTRODUCTION 2
METHODOLOGY 4
EMPIRICAL ANALYSIS 7
IMPLICATIONS FOR U.S. POWER 15
CONCLUSION 16
APPENDIX 1: FULL METHODOLOGY 17
APPENDIX 2: INDUSTRIES WITH THE GREATEST CHANGES IN VALUE ADDED 18
ENDNOTES 20
Figures 4
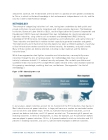
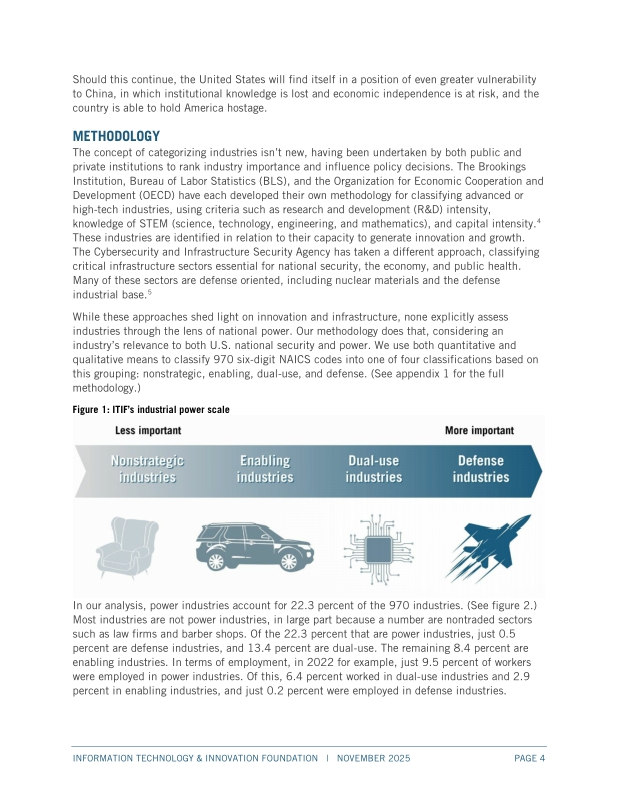
Figure 1. ITIF's industrial power scale 4
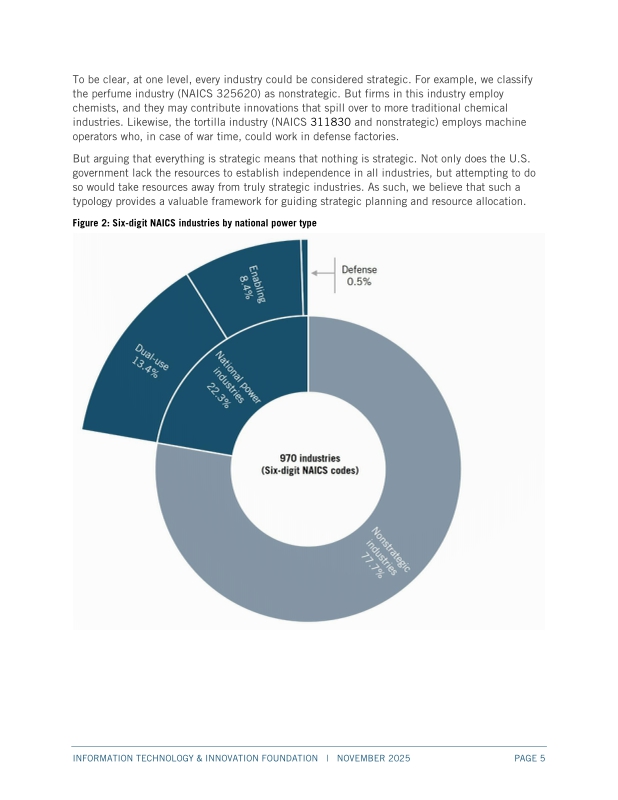
Figure 2. Six-digit NAICS industries by national power type 5
Figure 3. Change in value of manufacturing shipments (2007-2022) 8
Figure 4. Change in U.S. manufacturing value-added (2007-2022) 8
Figure 5. Change in U.S. manufacturing value added, PPI adjusted (2007-2022) 9
Figure 6. Change in U.S. manufacturing capital expenditures (2007-2022) 9
Figure 7. Change in U.S. manufacturing expenditures machinery and equipment (2007-2022) 10
Figure 8. Change in U.S. manufacturing expenditures on computers and data processing equipment (2007-2022) 10
Figure 9. Change in U.S. manufacturing electricity purchases (2007-2022) 11
Figure 10. Change in U.S. manufacturing employment (2007-2022) 11
Figure 11. Change in U.S. manufacturing employment relative to the overall economy 12
Figure 12. Change in U.S. manufacturing production workers (2007-2021) 12
Figure 13. Change in U.S. manufacturing non-production workers (2007-2022) 12
Figure 14. Change in U.S. manufacturing establishments (2007-2022) 13
Figure 15. Change in average employment per U.S. manufacturing establishment (2007-2022) 13
Figure 16. Share of U.S. industries in manufacturing vs. nonmanufacturing 14
Figure 17. Change in employment of nonmanufacturing industries (2007-2022) 14
Figure 18. Change in manufacturing median wages (2007-2022) 15
Appendix Tables 17
Table 1. Examples of national power industry categorizations based on ITIF's methodology 17
Table 2. Top industries with largest increase in nominal value added by classification 18
Table 3. Top industries with the greatest decline in value added by classification 19
*표시는 필수 입력사항입니다.
| 전화번호 |
|---|
| 기사명 | 저자명 | 페이지 | 원문 | 기사목차 |
|---|
| 번호 | 발행일자 | 권호명 | 제본정보 | 자료실 | 원문 | 신청 페이지 |
|---|
도서위치안내: / 서가번호:

우편복사 목록담기를 완료하였습니다.
*표시는 필수 입력사항입니다.
저장 되었습니다.
