
 대표어
대표어
 https://www.bruegel.org/working-paper/shifting-priorities-slow-progress-analysis-eu-tax-recommendations

권호기사보기
| 기사명 | 저자명 | 페이지 | 원문 | 기사목차 |
|---|
결과 내 검색
동의어 포함
Title page 1
Contents 1
1. Introduction 2
2. Efficient tax structures 3
3. EU tax structures 4
4. Data and method 7
5. EU tax policy trends 10
5.1. Tax-related recommendations 10
5.2. Trends by tax instrument 12
5.3. Trends by policy objective 15
5.4. Implementation trends 17
5.4.1. Implementation status across EU countries 18
6. Discussion 20
References 21
Appendix 23
Tables 9
Table 1. Tax instruments and associated keywords 9
Table 2. Policy objectives and associated keywords 10
Figures 5
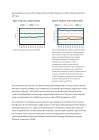
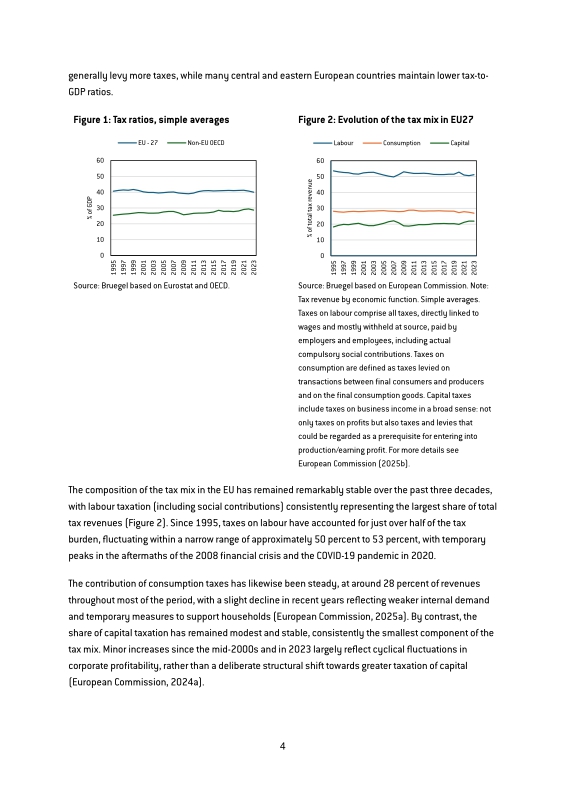
Figure 1. Tax ratios, simple averages 5
Figure 2. Evolution of the tax mix in EU27 5
Figure 3. Labour tax wedge 6
Figure 4. Environmental tax revenue, EU27 average 6
Figure 5. Evolution of tax-related CSRs (% of total CSRs) 11
Figure 6. Share of tax-related CSRs by country between 2011 and 2025 11
Figure 7. Tax-related recommendation trends by tax instrument (% of total tax-related CSRs) 12
Figure 8. Tax-related recommendation trends by policy objective 15
Figure 9. Distribution of implementation status of all tax-related recommendations issued between 2011 and 2024, evaluated in Semester cycle 2025 18
Figure 10. Successful implementation of tax-related recommendations issued between 2011 and 2024, evaluated in Semester cycle 2025, by EU country 19
Appendix Figures 23
Figure A1. Evolution of tax-related and all CSRs (absolute values) 23
Figure A2. Distribution of implementation status of tax-related recommendations issued in 2011, evaluated in Semester cycle 2025 23
Figure A3. Distribution of implementation status of tax-related recommendations issued in 2019, evaluated in Semester cycle 2025 24
Figure A4. Distribution of implementation status of all tax-related recommendations by tax instrument 24
Figure A5. Distribution of implementation status of all tax-related recommendations by policy objective 25
Figure A6. Distribution of implementation status of all non-tax-related recommendations (Semester cycle 2025) 25
*표시는 필수 입력사항입니다.
| 전화번호 |
|---|
| 기사명 | 저자명 | 페이지 | 원문 | 기사목차 |
|---|
| 번호 | 발행일자 | 권호명 | 제본정보 | 자료실 | 원문 | 신청 페이지 |
|---|
도서위치안내: / 서가번호:

우편복사 목록담기를 완료하였습니다.
*표시는 필수 입력사항입니다.
저장 되었습니다.
