
 대표어
대표어
 https://www.wipo.int/publications/en/details.jsp?id=4839&plang=EN
권호기사보기
| 기사명 | 저자명 | 페이지 | 원문 | 기사목차 |
|---|
결과 내 검색
동의어 포함
Title page 1
Contents 3
Abstract 2
1. Introduction 4
2. Mapping Clean Technologies, Diffusion Patterns and Mechanisms 6
2.1. What Clean Tech Is Needed, and Where 6
2.2. Clean Tech in the Past 20 Years: Where and How Much 10
2.3. Drivers and Barriers of Clean Tech Diffusion 17
2.3.1. Cost and Performance Considerations 18
2.3.2. Complementary inputs 21
2.3.3. Vested Interests and Political Economy 26
2.3.4. Conclusion 28
2.4. Looking Ahead: Challenges and Risks for the Next Phase of Diffusion 28
2.4.1. Critical Minerals: A Growing Constraint 28
2.4.2. Artificial intelligence: Opportunity and Trade-Offs 29
2.4.3. Political and Geopolitical Headwinds 30
2.4.4. Summary: What This Means for Diffusion 31
3. Case Study: Solar Energy 31
3.1. Technology-Push and Demand-Pull Policies Led to Major Cost Declines 31
3.2. China's Rise in the Solar PV Value Chain and Global Deployment 32
3.3. Barriers, Trade-offs and Challenges 35
3.3.1. Grid Integration and Infrastructure 35
3.3.2. Financing Constraints 36
3.3.3. Supply Chain Risks 38
3.3.4. Other Challenges 38
4. Case Study: Electric Vehicles 39
4.1. How We Got Here: Policy and Market Drivers 39
4.1.1. Norway: Consistent Incentives and Taxation 40
4.1.2. China: Industrial Strategy and Scale 40
4.1.3. California and the United States: Policy Heterogeneity 42
4.1.4. Contributions of Industrial Policies and Innovation 42
4.2. The Road Ahead: Prospects and Barriers for Broader Diffusion 43
4.2.1. Cost and Performance 43
4.2.2. Infrastructure 44
4.2.3. Financing and Equity 47
4.2.4. Incumbents, Politics, and Trade 48
5. Case Study: Hydrogen 48
5.1. Status of Diffusion by Hydrogen Colour 51
5.2. Barriers to Diffusion 52
5.3. Hydrogen Hubs as a Strategic Response 53
6. Conclusion 57
References 58
Tables 8
Table 1. Taxonomy of Mitigation Technologies and Associated Sectoral Breakdown of Global GHG Emissions 8
Table 2. Drivers and Barriers of Clean Tech Diffusion 19
Table 3/Table 4. Comparative Overview of Hydrogen Production Pathways 50
Table 4/Table 5. Overview of U.S. Regional Clean Hydrogen Hubs 56
Figures 5
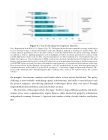
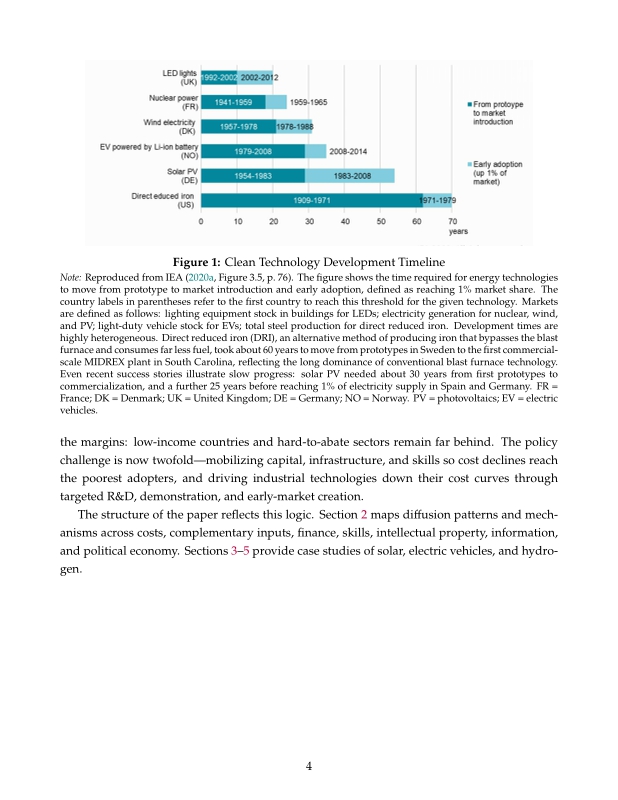
Figure 1. Clean Technology Development Timeline 5
Figure 2. Clean Tech Deployment 12
Figure 3. Patenting Trends in Clean Energy Technologies 13
Figure 4. Key Origin Countries in Solar and EV-Batteries Families Over Time 13
Figure 5. Origin-Destination Flows of Foreign-Oriented Patent Families 14
Figure 6. Levelized Cost of Electricity by Technology, 2009-2024 16
Figure 7. Solar PV panel prices vs. cumulative capacity 34
Figure 8. Installed Solar PV Capacity around the world over time 35
Figure 9. EV Diffusion 41
Figure 10. Levelized Cost of Driving (LCOD) Analysis: Technology Pathways for Transportation Decarbonization 45
Figure 11. Global Stock of Public Charging Points, 2018-2024 46
Figure 12. Electric Vehicles per Public Charging Point, 2016-2024 47
*표시는 필수 입력사항입니다.
| 전화번호 |
|---|
| 기사명 | 저자명 | 페이지 | 원문 | 기사목차 |
|---|
| 번호 | 발행일자 | 권호명 | 제본정보 | 자료실 | 원문 | 신청 페이지 |
|---|
도서위치안내: / 서가번호:

우편복사 목록담기를 완료하였습니다.
*표시는 필수 입력사항입니다.
저장 되었습니다.
