
 대표어
대표어
 https://www.iza.org/publications/dp/18390/delayed-retirement-effects-on-health-and-healthcare-utilization
권호기사보기
| 기사명 | 저자명 | 페이지 | 원문 | 기사목차 |
|---|
결과 내 검색
동의어 포함
Title page 1
Contents 1
Abstract 2
1. Introduction 3
2. Institutional Setting and Data 8
2.1. The Danish Pension System 8
2.2. The 2006 Welfare Agreement and the 2011 Retirement Reform 9
2.3. Data Sources 11
2.3.1. Health and Healthcare Utilization Outcomes 12
2.3.2. Labor Market Outcomes 14
3. Empirical Strategy 14
3.1. Window Choice 17
4. Results 18
4.1. The Increased ERA's Effect on Labor Force Participation 18
4.2. The Increased ERA's Effect on Health and Healthcare Utilization 22
4.2.1. Alternative Specifications and Robustness Checks 27
4.3. Additional Health and Healthcare Utilization Outcomes 29
4.4. Cutoff-Specific Effects 30
5. Mechanisms 31
5.1. Characterization of Compliers 31
5.2. Treatment Effect Heterogeneity using Causal Forest 35
5.3. Marginal Health and Healthcare Utilization Effects of Increased ERA 40
5.3.1. Estimated MTEs 41
6. Discussion and Conclusion 43
Bibliography 45
Appendix 54
A. Overview of Selected Literature 54
B. Details on Data and Variables 55
C. Alternative Specifications and Robustness 61
D. Additional Results 72
E. Heterogeneous Treatment Effects Estimated by Causal Forest 84
F. Marginal Treatment Effects 92
Tables 19
Table 1. Effects on Labor Force Participation 19
Table 2. Effects on Health and Healthcare Utilization Outcomes 23
Table 3. Effects on Health and Healthcare Utilization Outcomes 26
Table 4. Estimated Treatment Effect Parameters 42
Figures 3
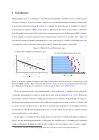
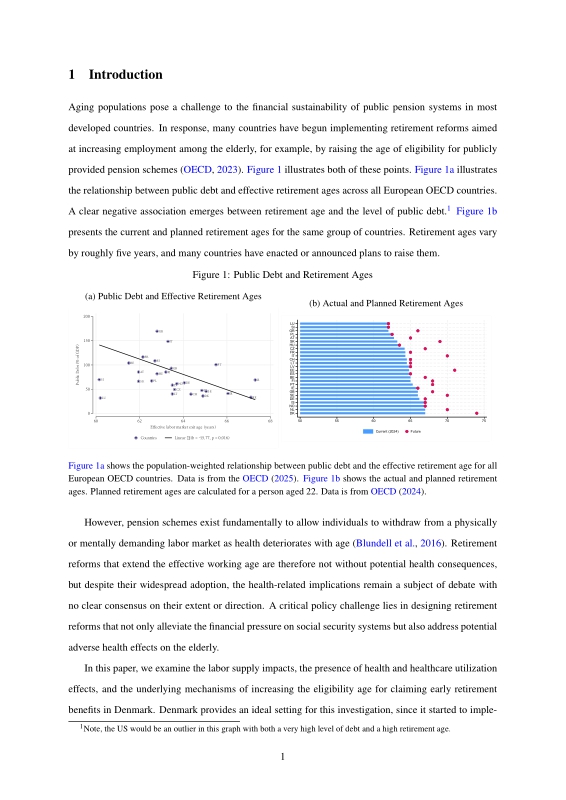
Figure 1. Public Debt and Retirement Ages 3
Figure 2. The 2011 Reform's Effect on Retirement Ages 10
Figure 3. Employment Degree for Cohorts Across Age 11
Figure 4. Effects on Labor Force Participation 20
Figure 5. Dynamic Effects on Labor Force Participation 21
Figure 6. Effects on Health and Healthcare Utilization Outcomes 24
Figure 7. Effects on Health and Healthcare Utilization Outcomes Over Time 25
Figure 8. Characterization of ERA Compliers 34
Figure 9. Estimated Group Average Treatment Effects (1/2) 37
Figure 10. Estimated Group Average Treatment Effects (2/2) 38
Figure 11. Estimated Marginal Treatment Effects 43
Appendix Tables 54
Table A.1. Literature Overview 54
Table B.1. Sample Descriptives 56
Table C.1. Effects on LFP - Conditional on Employment in Previous Period 62
Table C.2. The Continuity Framework: Effects on Health and Healthcare Utilization Outcomes 63
Table C.3. Effects on Health and Healthcare Utilization Outcomes 67
Table C.4. RD-DD: Effects on Health Outcomes 69
Table C.5. Pooled RD-DD: Effects on Health Outcomes: ERA payment 71
Table D.1. Effects on Health and Healthcare Utilization Outcomes 73
Table D.2. Effects on Mortality 74
Table D.3. Effects on Health and Healthcare Utilization Outcomes: 1954:Q2-1954:Q3 78
Table D.4. Effects on Health and Healthcare Utilization Outcomes: 1955:Q2-1955:Q3 79
Table D.5. Effects on Health and Healthcare Utilization Outcomes: 1953:Q4-1954:Q1 80
Table D.6. Effects on Health and Healthcare Utilization Outcomes: 1954:Q4-1955:Q1 81
Table D.7. Effects on Health and Healthcare Utilization Outcomes: 1956:Q2-1956:Q3 82
Table E.1. GP Visits: Characteristics for Individuals with High vs. Low Predicted Treatment Effects 88
Table E.2. Painkillers: Characteristics for Individuals with High vs. Low Predicted Treatment Effects 89
Table E.3. Antidepressants: Characteristics for Individuals with High vs. Low Predicted Treatment Effects 90
Table E.4. CVD Medicine: Characteristics for Individuals with High vs. Low Predicted Treatment Effects 91
Table F.1. Estimating MTEs: First Stage 95
Table F.2. Marginal Treatment Effects - Different Specification Choices 96
Appendix Figures 55
Figure B.1. Frequency of Birth Dates 55
Figure B.2. Prevalence of CVD Medicine, Painkillers, and Antidepressants 57
Figure B.3. Prevalence of All Medicine Categories (ATC 1st level) 57
Figure B.4. Decomposition of Selected Medicine Categories 58
Figure B.5. GP Visits by Month 58
Figure B.6. Transfers Excl. Retirement Benefits 59
Figure B.7. Ordinary Transfers and Health-Related Transfers 59
Figure B.8. Labor Force Participation Over Time 60
Figure C.1. Choosing the Bandwidth, w 61
Figure C.2. Continuity Assumption: Effects on Health Outcomes 64
Figure C.3. Robustness to Bandwidth Choice 65
Figure C.4. Donut Hole Specifications 66
Figure C.5. RD-DD: Effects on Health Outcomes 69
Figure C.6. Pooled RD-DD: Effects on Health Outcomes: ERA payment 71
Figure D.1. Dynamic Effects on Additional Health and Healthcare Utilization Outcomes 74
Figure D.2. Effects on Health and Healthcare Utilization Outcomes Over Time: 1954:Q2-1954:Q3 76
Figure D.3. Effects on Health and Healthcare Utilization Outcomes Over Time: 1955:Q2-1955:Q3 77
Figure D.4. Characterization of ERA Compliers 86
Figure F.1. Common Support and Treatment Parameter Weights 94
Figure F.2. Marginal Treatment Effect Curves - Different Specification Choices 97
*표시는 필수 입력사항입니다.
| 전화번호 |
|---|
| 기사명 | 저자명 | 페이지 | 원문 | 기사목차 |
|---|
| 번호 | 발행일자 | 권호명 | 제본정보 | 자료실 | 원문 | 신청 페이지 |
|---|
도서위치안내: / 서가번호:

우편복사 목록담기를 완료하였습니다.
*표시는 필수 입력사항입니다.
저장 되었습니다.
