 https://www.fhwa.dot.gov/publications/research/safety/18035/index.cfm


권호기사보기
| 기사명 | 저자명 | 페이지 | 원문 | 기사목차 |
|---|
| 대표형(전거형, Authority) | 생물정보 | 이형(異形, Variant) | 소속 | 직위 | 직업 | 활동분야 | 주기 | 서지 | |
|---|---|---|---|---|---|---|---|---|---|
| 연구/단체명을 입력해주세요. | |||||||||
|
|
|
|
|
|
* 주제를 선택하시면 검색 상세로 이동합니다.
Title page
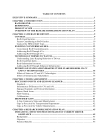
Contents
FOREWORD 2
LIST OF ABBREVIATIONS AND SYMBOLS 10
EXECUTIVE SUMMARY 12
CHAPTER 1. INTRODUCTION 13
BACKGROUND 13
DEFINITIONS 14
PROJECT SCOPE 15
OVERVIEW OF THE RESEARCH IMPLEMENTATION PLAN 15
CHAPTER 2. LITERATURE REVIEW 18
CONTEXT 18
RwD-Crash Statistics 18
Factors Contributing to RwD Crashes 19
Goals of the FHWA RwD Team 20
EXISTING COUNTERMEASURES 21
Conventional RwD Countermeasures 21
Addressing RwD Through AVs 24
Addressing RwD Through CVs 32
TECHNOLOGY TRENDS TO WATCH 35
Understanding Lane-Keeping Behaviors of Drivers 35
RwD-Crash Risk Index 37
Road-Information Inventory 38
Addressing RwD Through Enhanced Infrastructure 41
EFFORTS OF STATES AND INFRASTRUCTURE STAKEHOLDERS ON CV AND AV TECHNOLOGIES 43
Efforts of States on CV and AV Technologies 43
Efforts of Infrastructure Stakeholders 45
CHAPTER 3. NEEDS ASSESSMENT 46
DISCUSSION POINTS AND LESSONS LEARNED 46
Standards 46
Infrastructure Differences for CVs and AVs 48
Signage, Roadside, and Friction Information 49
Sparse, Rural Areas 49
Staff Training 49
Collaboration 50
IDENTIFIED GAPS 50
A Gap Common to States and Manufacturers 50
Gaps as Perceived by Transportation Departments 51
Gaps as Perceived by Vehicle Manufacturers 51
CHAPTER 4. RESEARCH IMPLEMENTATION PLAN 53
INITIATIVE 1. EFFECTIVENESS ESTIMATES OF CURRENT DRIVER ASSISTANCE 53
Background 53
Objective 54
Potential Benefits 54
Relationships to the Existing Body of Knowledge 54
Tasks 54
INITIATIVE 2. CHARACTERIZATION OF LANE-KEEPING PRACTICES 55
Background 55
Objective 55
Potential Benefits 55
Relationship to the Existing Body of Knowledge 56
Tasks 56
Follow-On and Implementation Activities 56
INITIATIVE 3. SIMULATIONS TO ESTIMATE THE BENEFITS OF CV COUNTERMEASURES FOR RwDs 57
Background 57
Objective 57
Potential Benefits 57
Relationships to the Existing Body of Knowledge 57
Tasks 57
Follow-On and Implementation Activities 58
INITIATIVE 4. CURVE-WARNING CHALLENGE 58
Background 58
Objective 59
Potential Benefits 59
Relationships to the Existing Body of Knowledge 59
Tasks 59
INITIATIVE 5. EXTENSIONS TO THE CSW APPLICATION 60
Background 60
Objective 60
Potential Benefits 60
Relationship to the Existing Body of Knowledge 60
Tasks 61
INITIATIVE 6. INPUT FROM STATE AND LOCAL TRANSPORTATION DEPARTMENTS AND OTHER STAKEHOLDERS 61
Background 61
Objective 62
Potential Benefits 62
Relationships to the Existing Body of Knowledge 62
Tasks 62
Follow-On and Implementation Activities 63
INITIATIVE 7. V2I TECHNOLOGY-AWARENESS TRAINING FOR STATE AGENCIES 63
Background 63
Objective 64
Potential Benefits 64
Relationships to the Existing Body of Knowledge 64
Tasks 64
Follow-On and Implementation Activities 65
INITIATIVE 8. SOFTWARE AID TO DESIGN FOR ACCOMMODATING CVs AND AVs 65
Background 65
Objective 65
Potential Benefits 66
Relationships to the Existing Body of Knowledge 66
Tasks 66
Follow-On and Implementation Activities 66
INITIATIVE 9. TIGHTER MARKING AND SIGN REQUIREMENTS IN THE MUTCD 66
Background 66
Objective 67
Potential Benefits 67
Relationships to the Existing Body of Knowledge 67
Tasks 67
Follow-On and Implementation Activities 68
INITIATIVE 10. SYNTHESIS OF MACHINE-READABLE SIGN TECHNOLOGY 68
Background 68
Objective 69
Potential Benefits 69
Relationships to the Existing Body of Knowledge 69
Tasks 69
Follow-On and Implementation Activities 70
INITIATIVE 11. IDENTIFICATION OF HIGH-RISK LOCATIONS USING CV DATA 70
Background 70
Objective 70
Potential Benefits 71
Relationships to the Existing Body of Knowledge 71
Tasks 71
Follow-On and Implementation Activities 72
EXISTING AND SMALLER EFFORTS 72
Road Weather Information to AVs 72
Standards and Business Model for Maintaining and Delivering Roadway Geometry 72
Standard for Pavement-Marking Removal 73
Recovery Guidance for Errant Vehicles 73
RwD-Safety Risk Index for Road Segments 73
Reconsidered Geometric Design for AVs 74
New IHSDM Module for CV and AV Technology 74
CHAPTER 5. CONCLUSIONS 75
LITERATURE REVIEW 75
GAP ANALYSIS 76
RESEARCH IMPLEMENTATION PLAN 76
APPENDIX. WEB MEETING PARTICIPANTS 79
WEB MEETING 1 79
WEB MEETING 2 79
WEB MEETING 3 79
REFERENCES 80
Figure 1. Graphic. SAE automation levels range from 0 (no automation) to 5 (full automation) 14
Figure 2. Graphic. Recommended research topics are a diverse yet cohesive approach to improving RwD safety 16
Figure 3. Pie chart. Proportion of RwD fatalities by most harmful event of the crash 19
Figure 4. Pie chart. Most causes of passenger-car unintentional lane departures are driver actions or inactions 20
Figure 5. Photo. Arrow signs and chevrons can be used separately or in combination 23
Figure 6. Photos. Pavement treatments to improve RwD safety 24
Figure 7. Photo. High-resolution, 3D map for use by AVs in Mcity 40
Figure 8. Photo. Ohio DOT van precisely tracks its position relative to the roadway as it gathers data on pavement conditions 41
*표시는 필수 입력사항입니다.
| 전화번호 |
|---|
| 기사명 | 저자명 | 페이지 | 원문 | 기사목차 |
|---|
| 번호 | 발행일자 | 권호명 | 제본정보 | 자료실 | 원문 | 신청 페이지 |
|---|
도서위치안내: / 서가번호:

우편복사 목록담기를 완료하였습니다.
*표시는 필수 입력사항입니다.
저장 되었습니다.
