표·그림DB
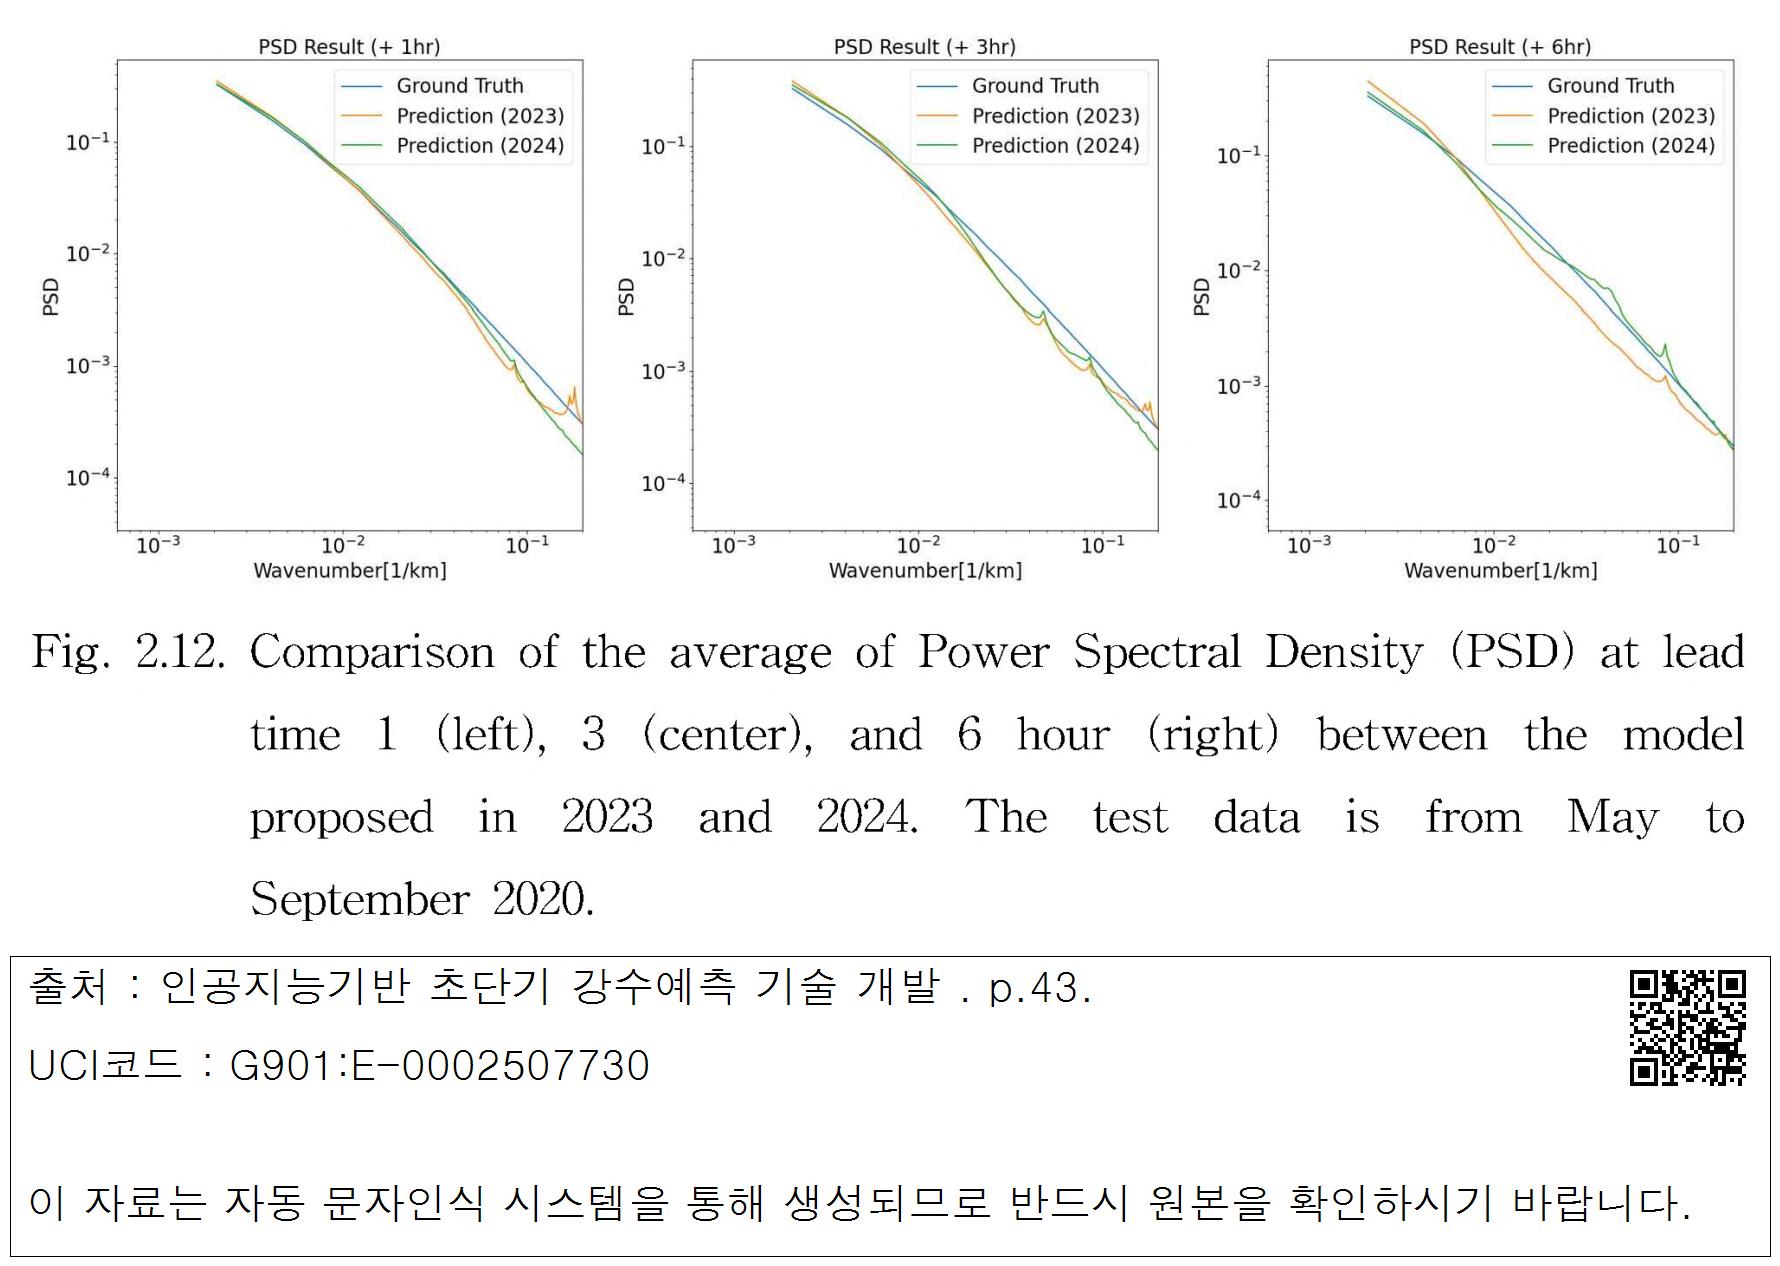
Fig, 2.12. Comparison of the average of Power Spectral Density (PSD) at lead time 1 (left), 3 (center), and 6 hour (right) between the model proposed in 2023 and 2024. The test data is from May to September 2020
표·그림명
Fig, 2.12. Comparison of the average of Power Spectral Density (PSD) at lead time 1 (left), 3 (center), and 6 hour (right) between the model proposed in 2023 and 2024. The test data is from May to September 2020

 대표어