표·그림DB
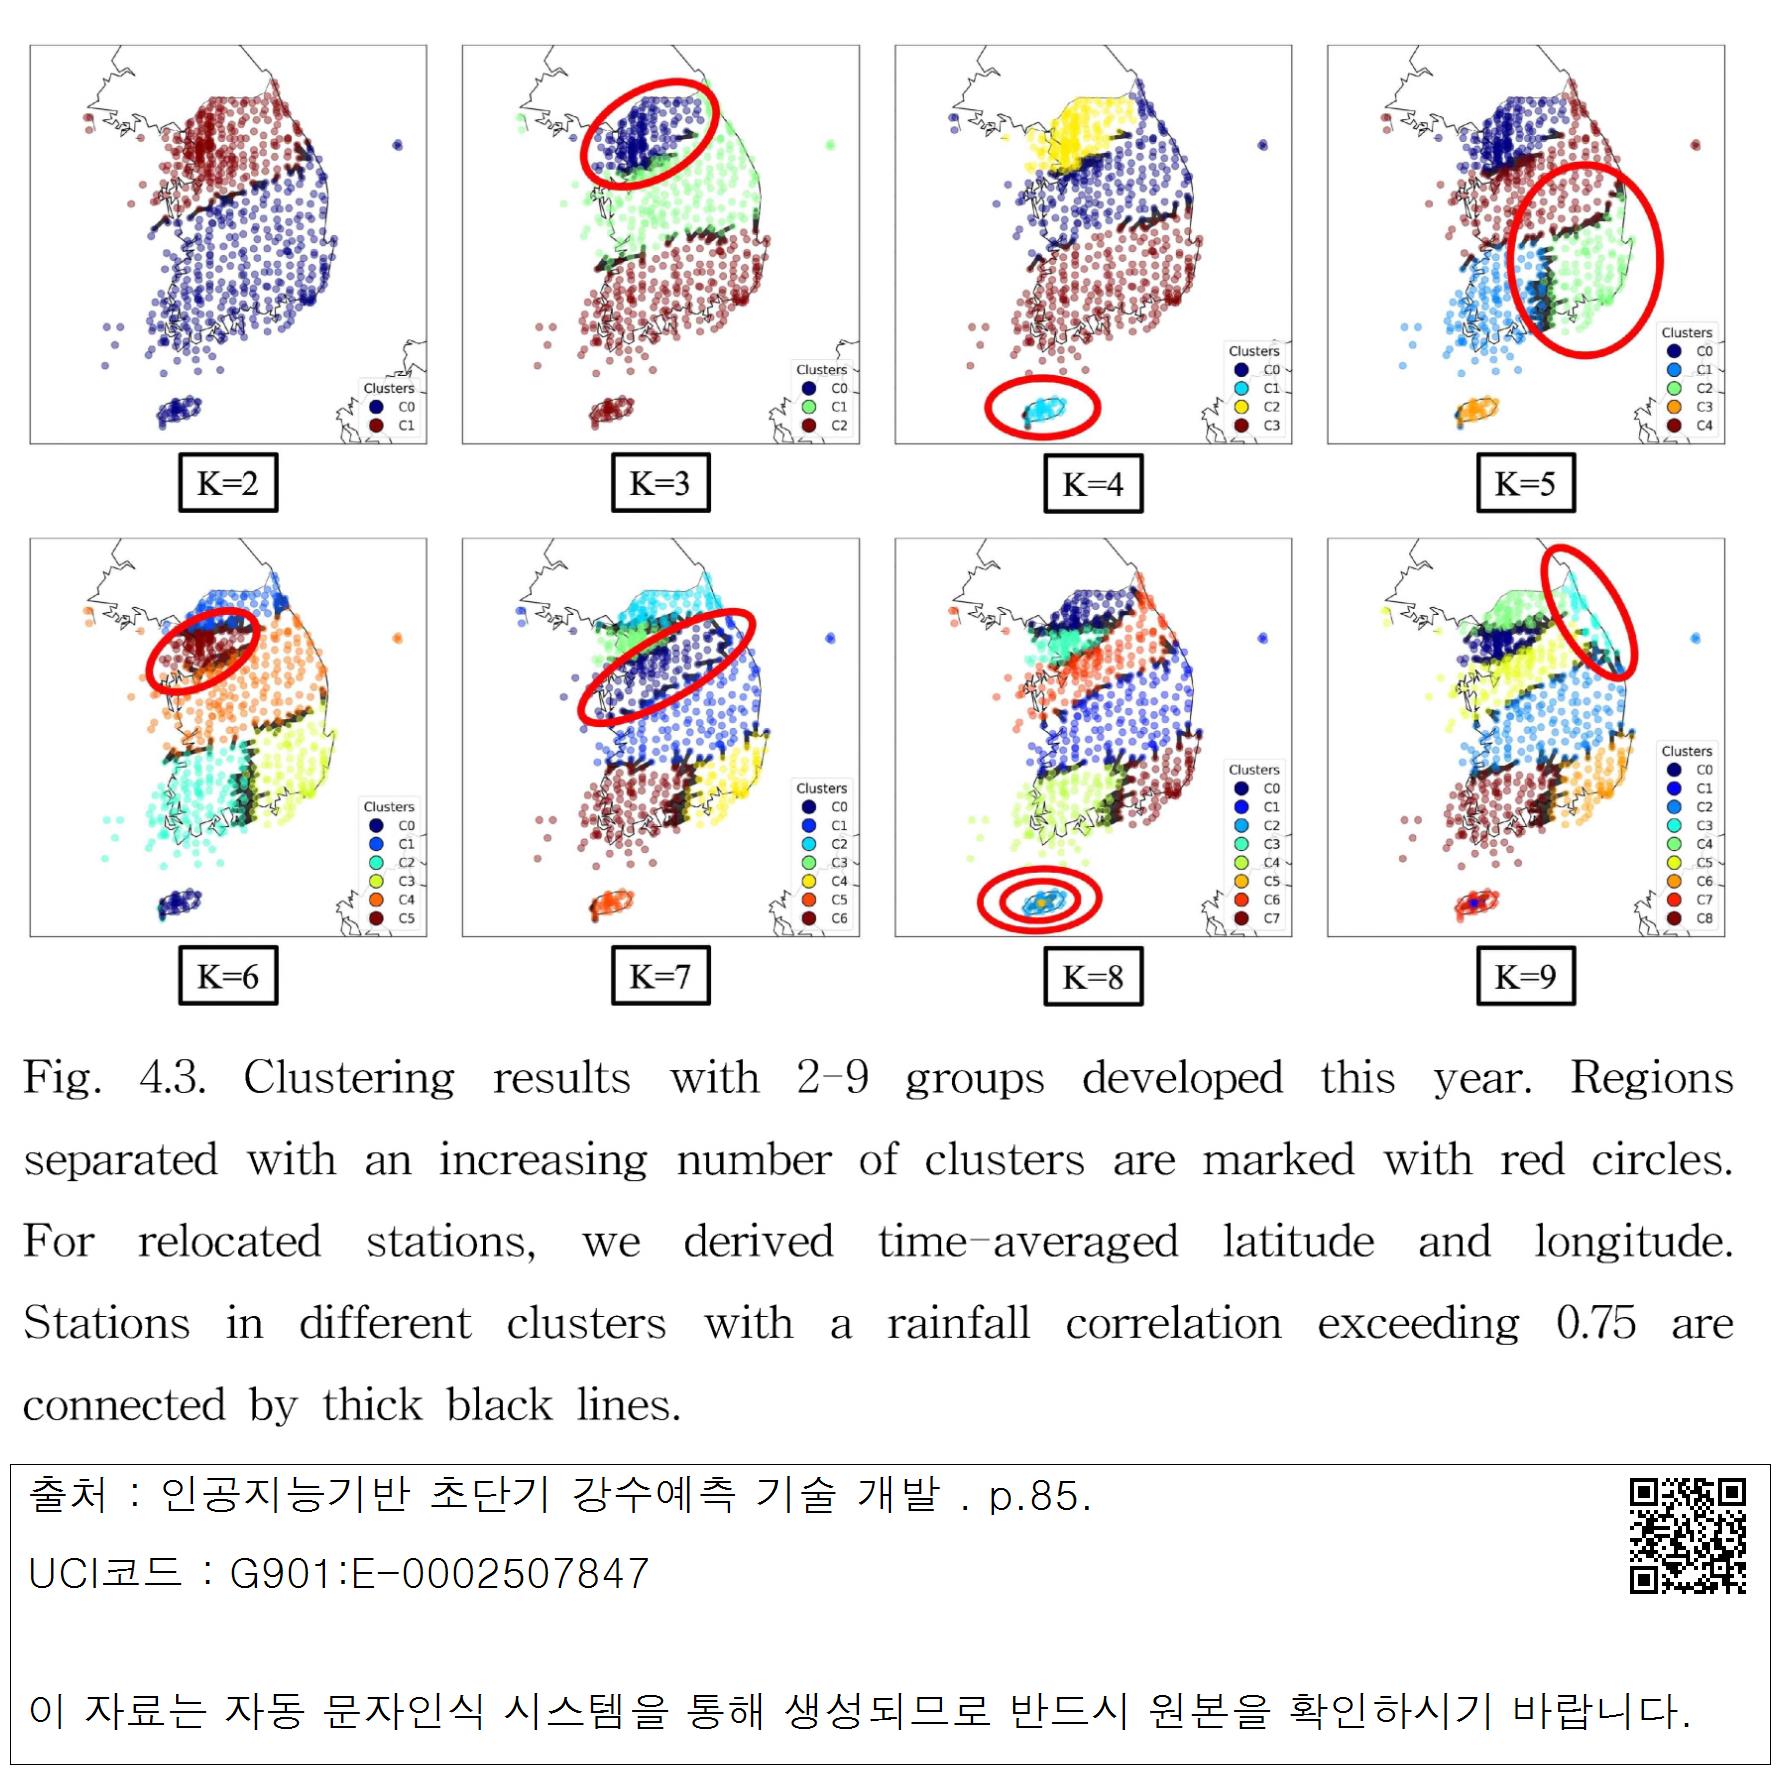
Fig. 4.3. Clustering results with 2-9 groups developed this year. Regions separated with an increasing number of clusters are marked with red circles. For relocated stations, we derived time-averaged latitude and longitude. Stations in different clusters with a rainfall correlation exceeding 0.75 are connected by thick black lines.
표·그림명
Fig. 4.3. Clustering results with 2-9 groups developed this year. Regions separated with an increasing number of clusters are marked with red circles. For relocated stations, we derived time-averaged latitude and longitude. Stations in different clusters with a rainfall correlation exceeding 0.75 are connected by thick black lines.

 대표어