표·그림명
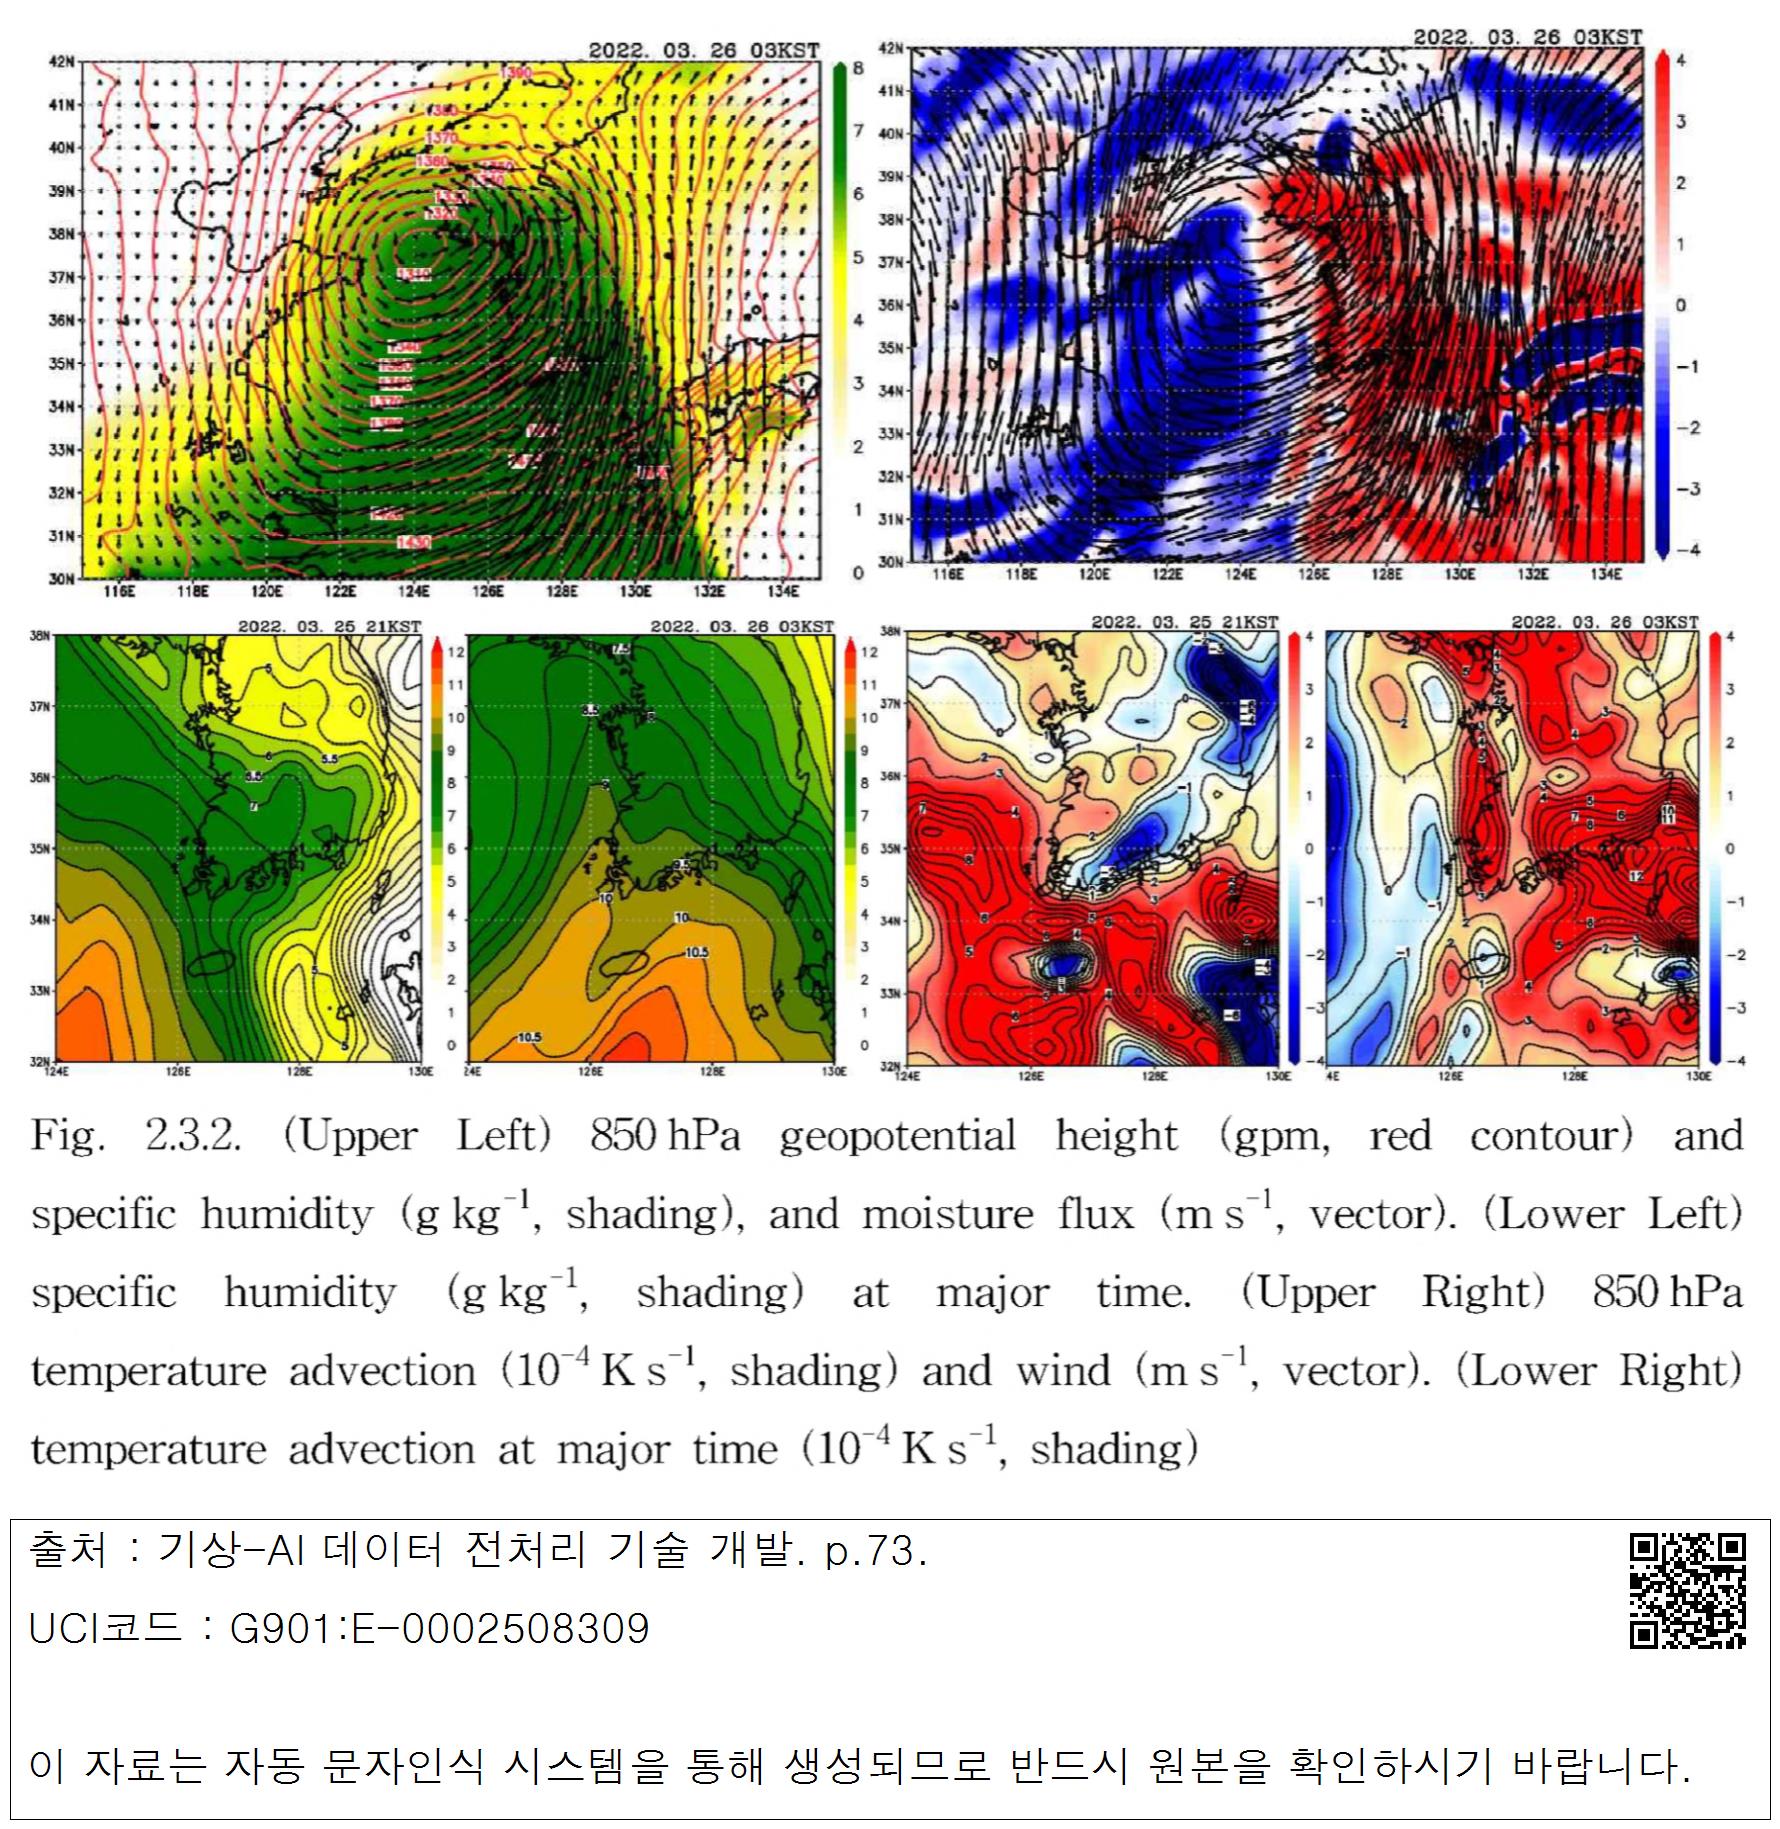
Fig. 2.3.2. (Upper Left) 850 hPa geopotential height (gpm, red contour) and specific humidity (g kg⁻¹, shading), and moisture flux (m s⁻¹, vector). (Lower Left) specific humidity (g kg⁻¹, shading) at major time. (Upper Right) 850 hPa temperature advection (10⁻⁴ K s⁻¹, shading) and wind (m s⁻¹, vector). (Lower Right) temperature advection at major time (10⁻⁴ K s⁻¹, shading)

 대표어