표·그림DB
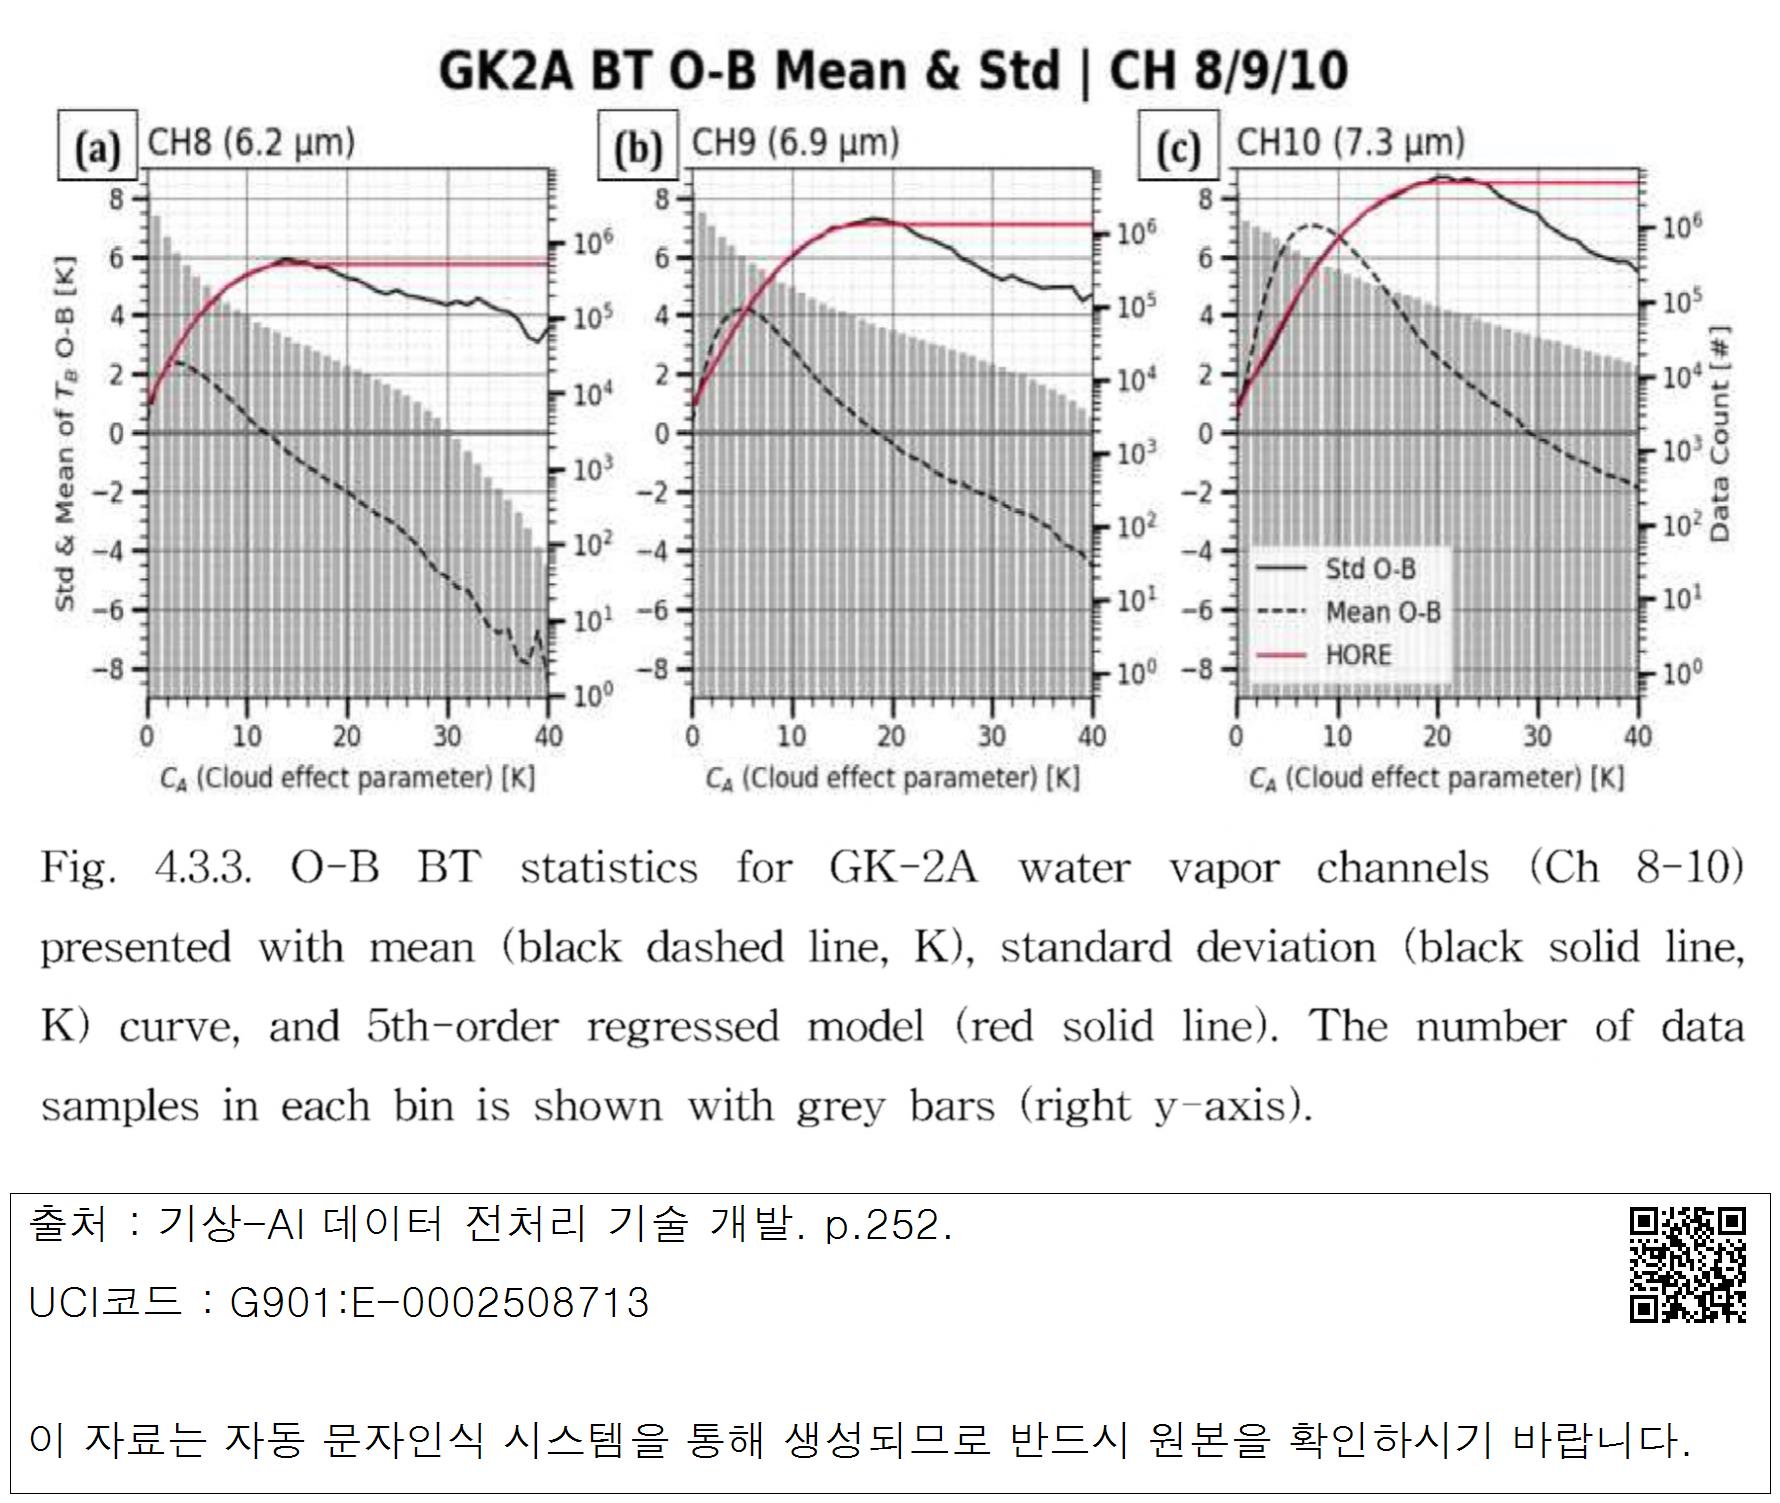
Fig. 4.3.3. 0-B BT statistics for GK-2A water vapor channels (Ch 8-10) presented with mean (black dashed line, K), standard deviation (black solid line, K) curve, and Sth-order regressed model (red solid line). The number of data samples in each bin is shown with grey bars (right y-axis).
표·그림명
Fig. 4.3.3. 0-B BT statistics for GK-2A water vapor channels (Ch 8-10) presented with mean (black dashed line, K), standard deviation (black solid line, K) curve, and Sth-order regressed model (red solid line). The number of data samples in each bin is shown with grey bars (right y-axis).

 대표어