표·그림DB
Fig. 4.3.40. Plots of 3-dimensional wind field data about 20:00 UTC 5 November 2023. (a) 2km Z, (b) 2km wind speed. Red line is cross section line, (c) Cross section of Z, (d) cross section of wind speed.
표·그림명
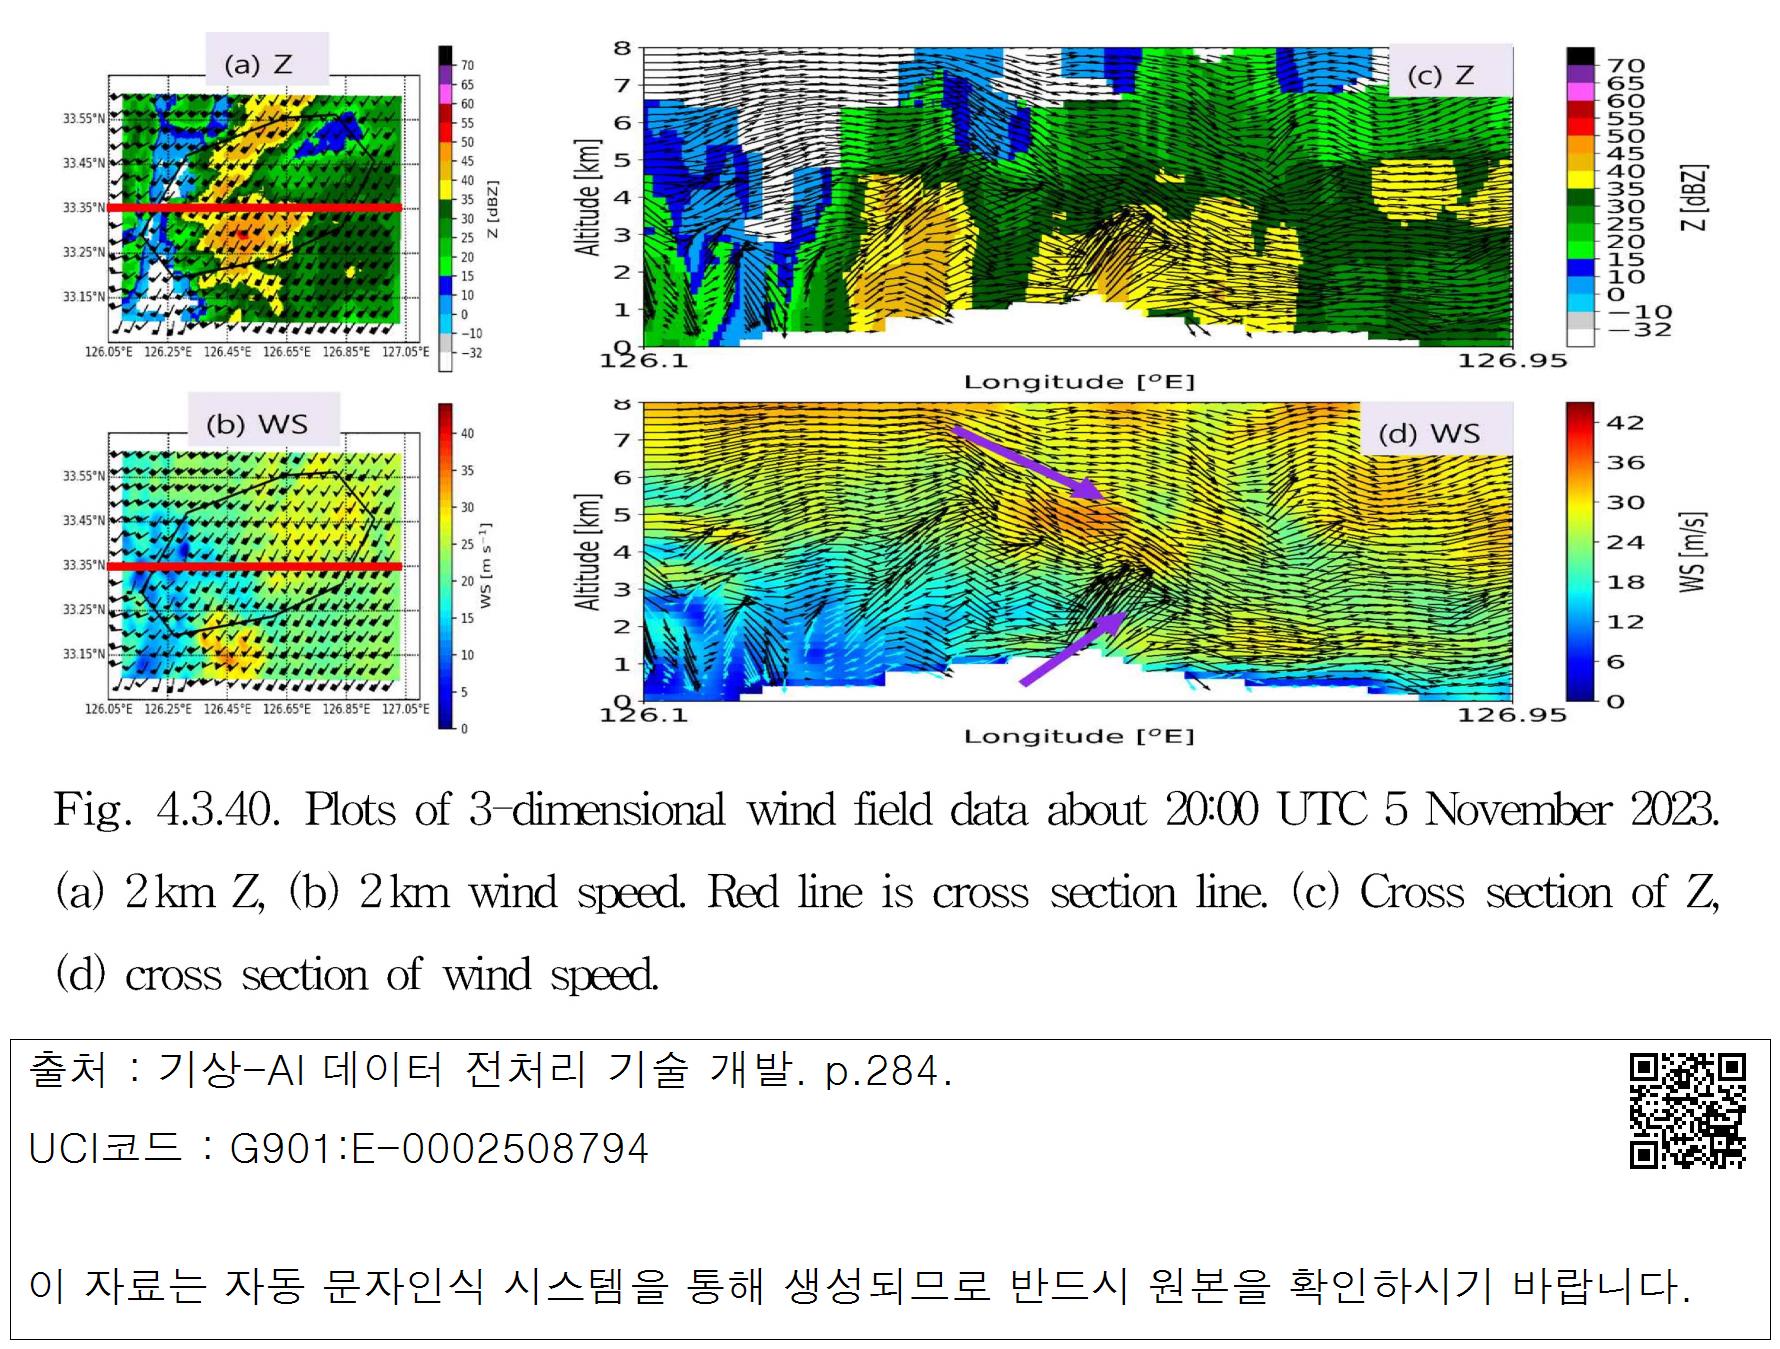
Fig. 4.3.40. Plots of 3-dimensional wind field data about 20:00 UTC 5 November 2023. (a) 2km Z, (b) 2km wind speed. Red line is cross section line, (c) Cross section of Z, (d) cross section of wind speed.

 대표어