표·그림DB
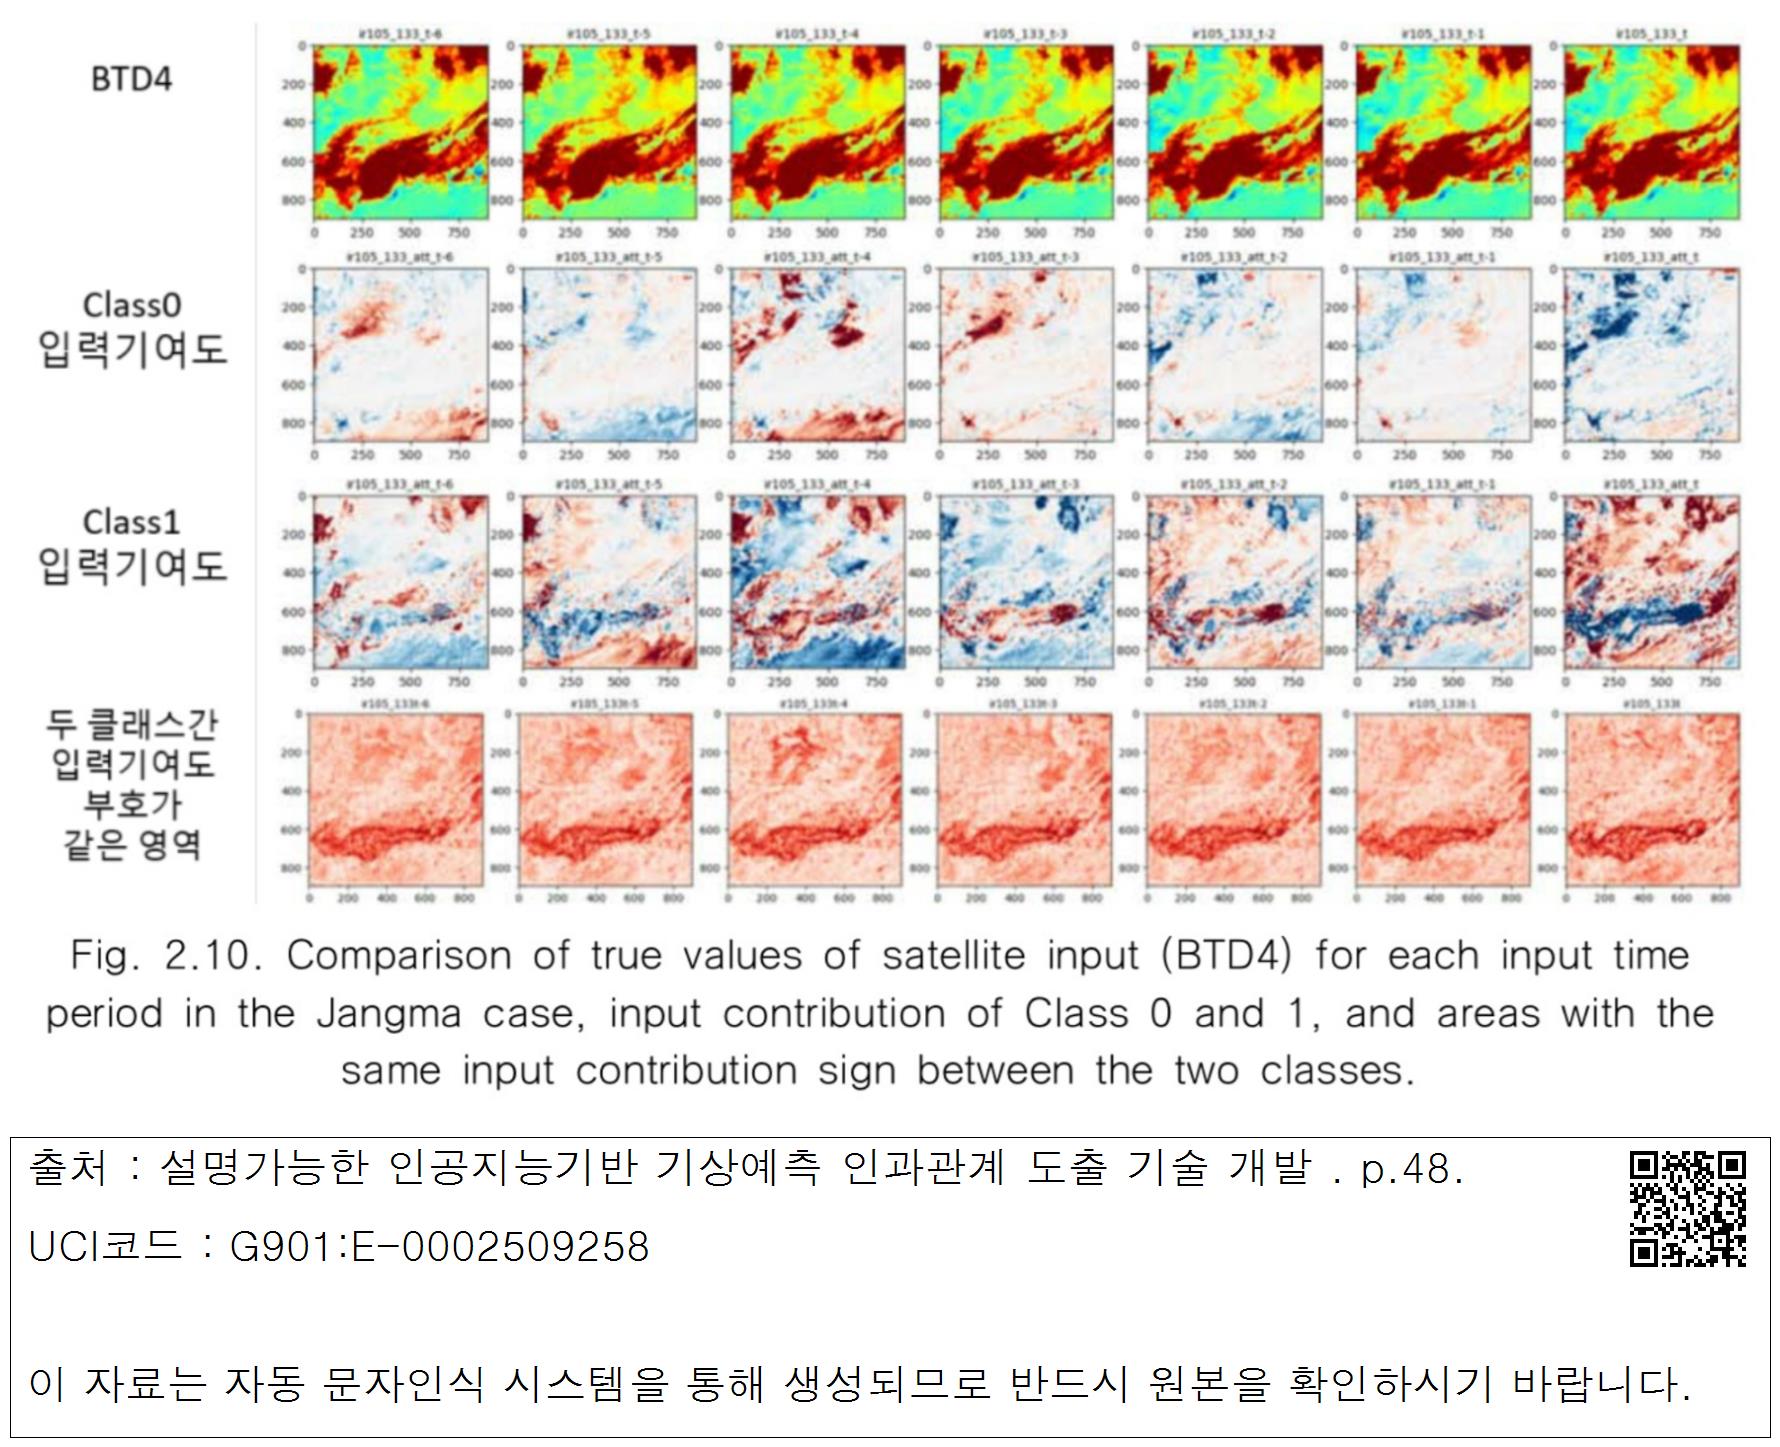
Fig. 2.10. Comparison of true values of satellite input (BTD4) for each input time period in the Jangma case, input contribution of Class 0 and 1, and areas with the same input contribution sign between the two classes.
표·그림명
Fig. 2.10. Comparison of true values of satellite input (BTD4) for each input time period in the Jangma case, input contribution of Class 0 and 1, and areas with the same input contribution sign between the two classes.

 대표어