표·그림DB
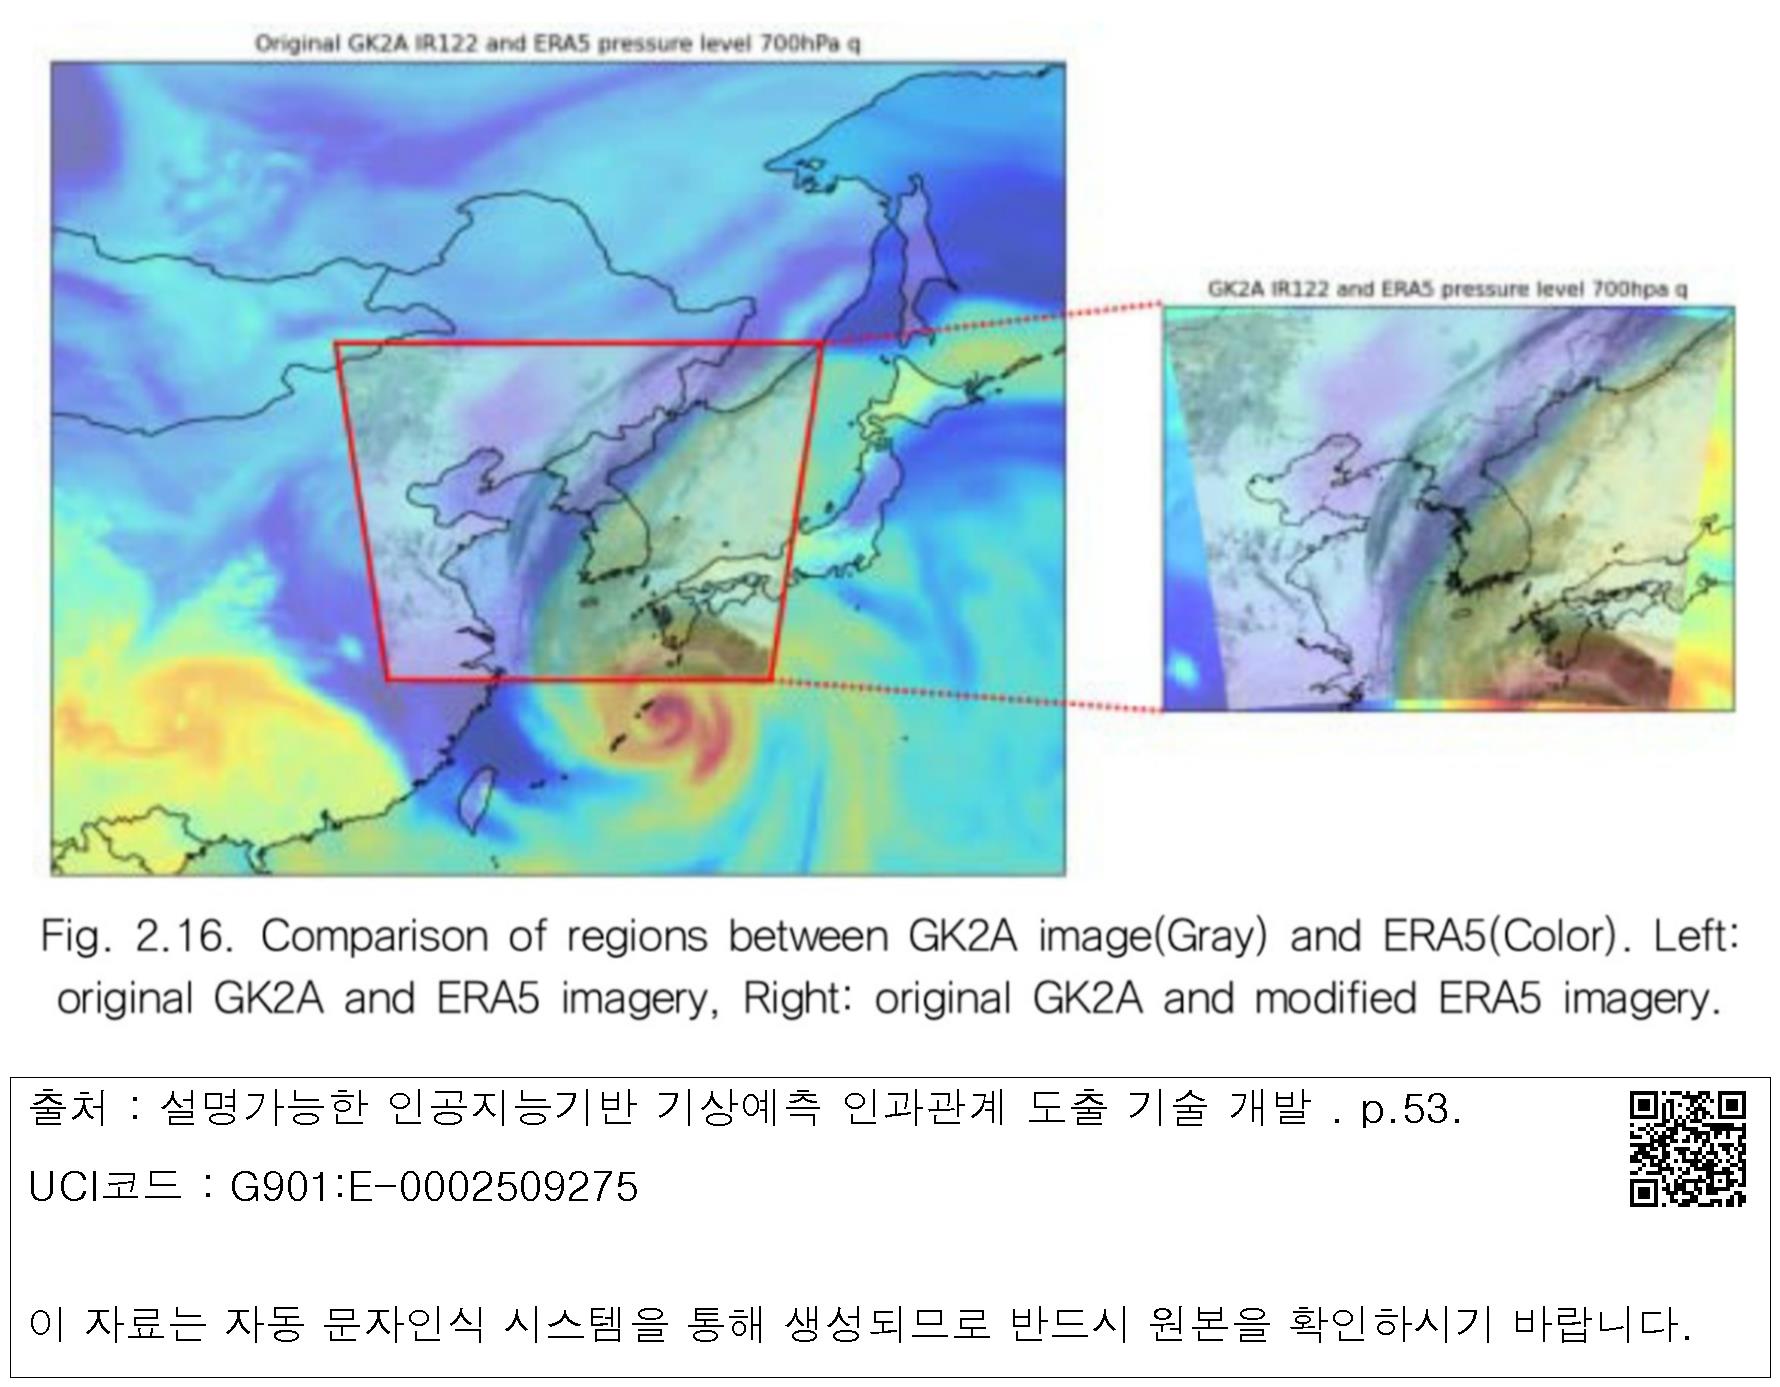
Fig. 2.16. Comparison of regions between GK2A image(Gray) and ERA5(Color). Left: original GK2A and ERAS imagery, Right: original GK2A and modified ERAS imagery.
표·그림명
Fig. 2.16. Comparison of regions between GK2A image(Gray) and ERA5(Color). Left: original GK2A and ERAS imagery, Right: original GK2A and modified ERAS imagery.

 대표어