표·그림DB
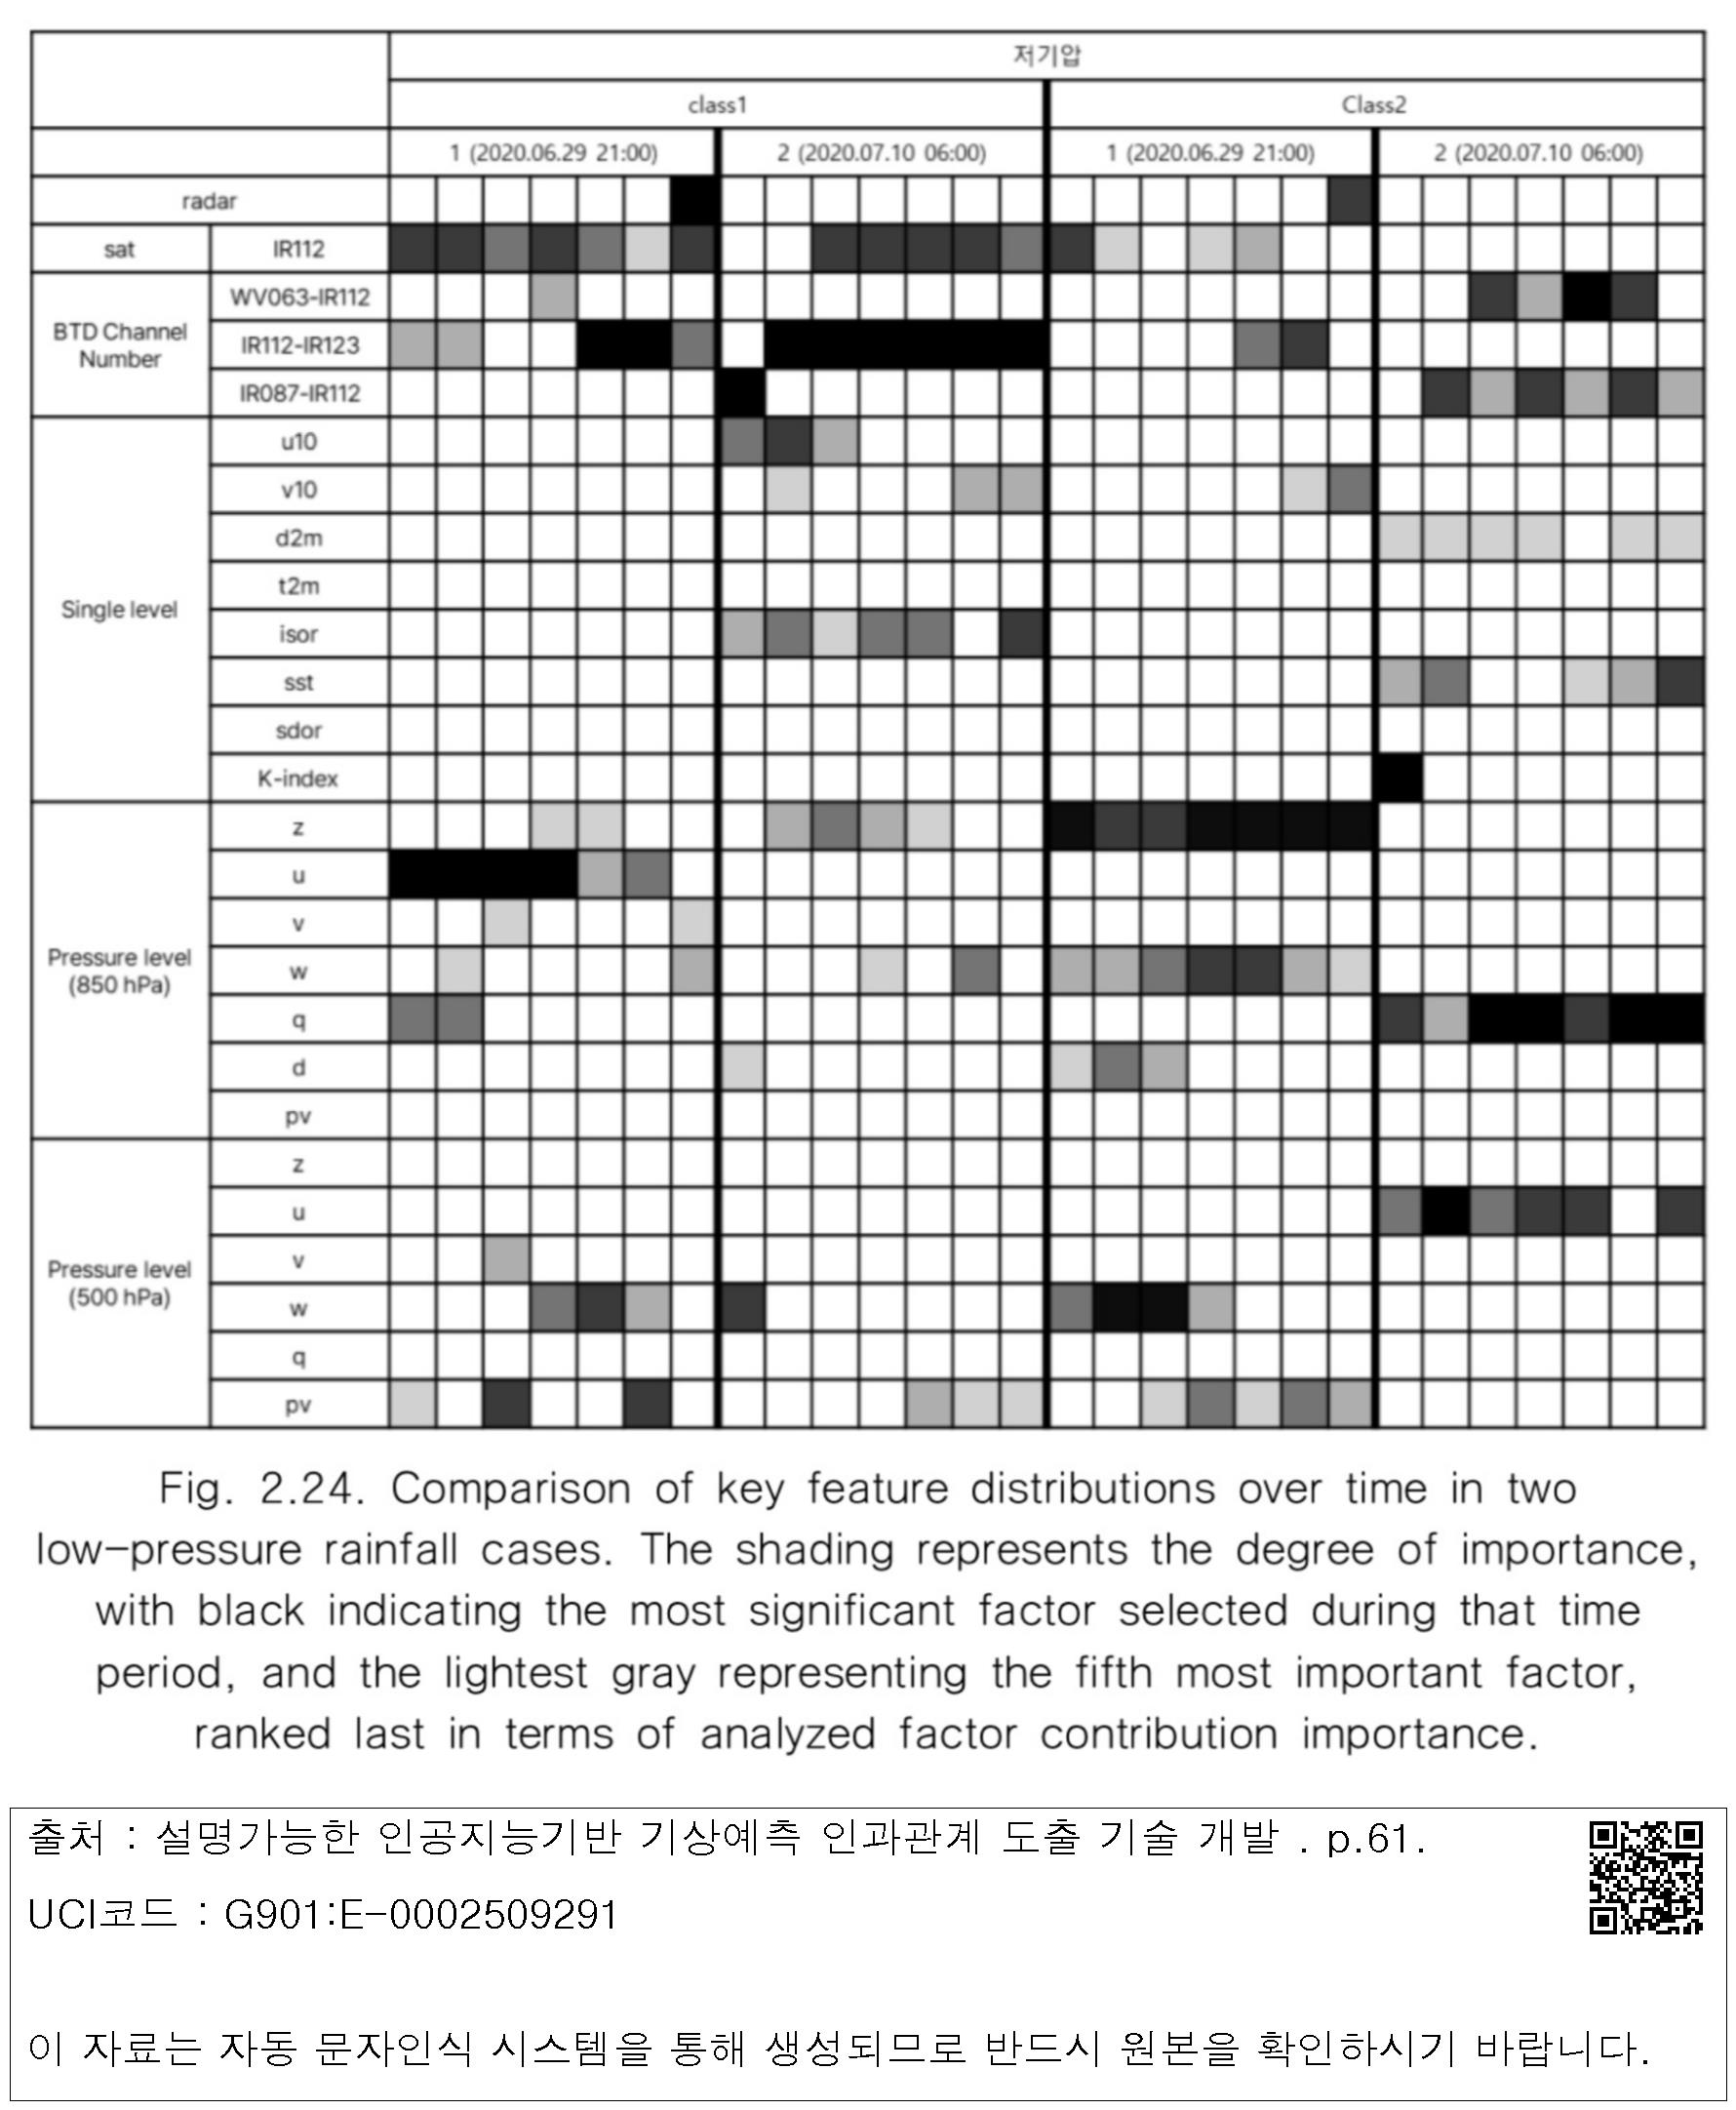
Fig. 2.24. Comparison of key feature distributions over time in two low-pressure rainfall cases. The shading represents the degree of importance, with black indicating the most significant factor selected during that time period, and the lightest gray representing the fifth most important factor, ranked last in terms of analyzed factor contribution importance.
표·그림명
Fig. 2.24. Comparison of key feature distributions over time in two low-pressure rainfall cases. The shading represents the degree of importance, with black indicating the most significant factor selected during that time period, and the lightest gray representing the fifth most important factor, ranked last in terms of analyzed factor contribution importance.

 대표어